Uptime and status pages
Since v0.17.1 Falak checks that your sites answer, from the control plane. Uptime runs in the control plane only: it needs no agent update and no observability stack.
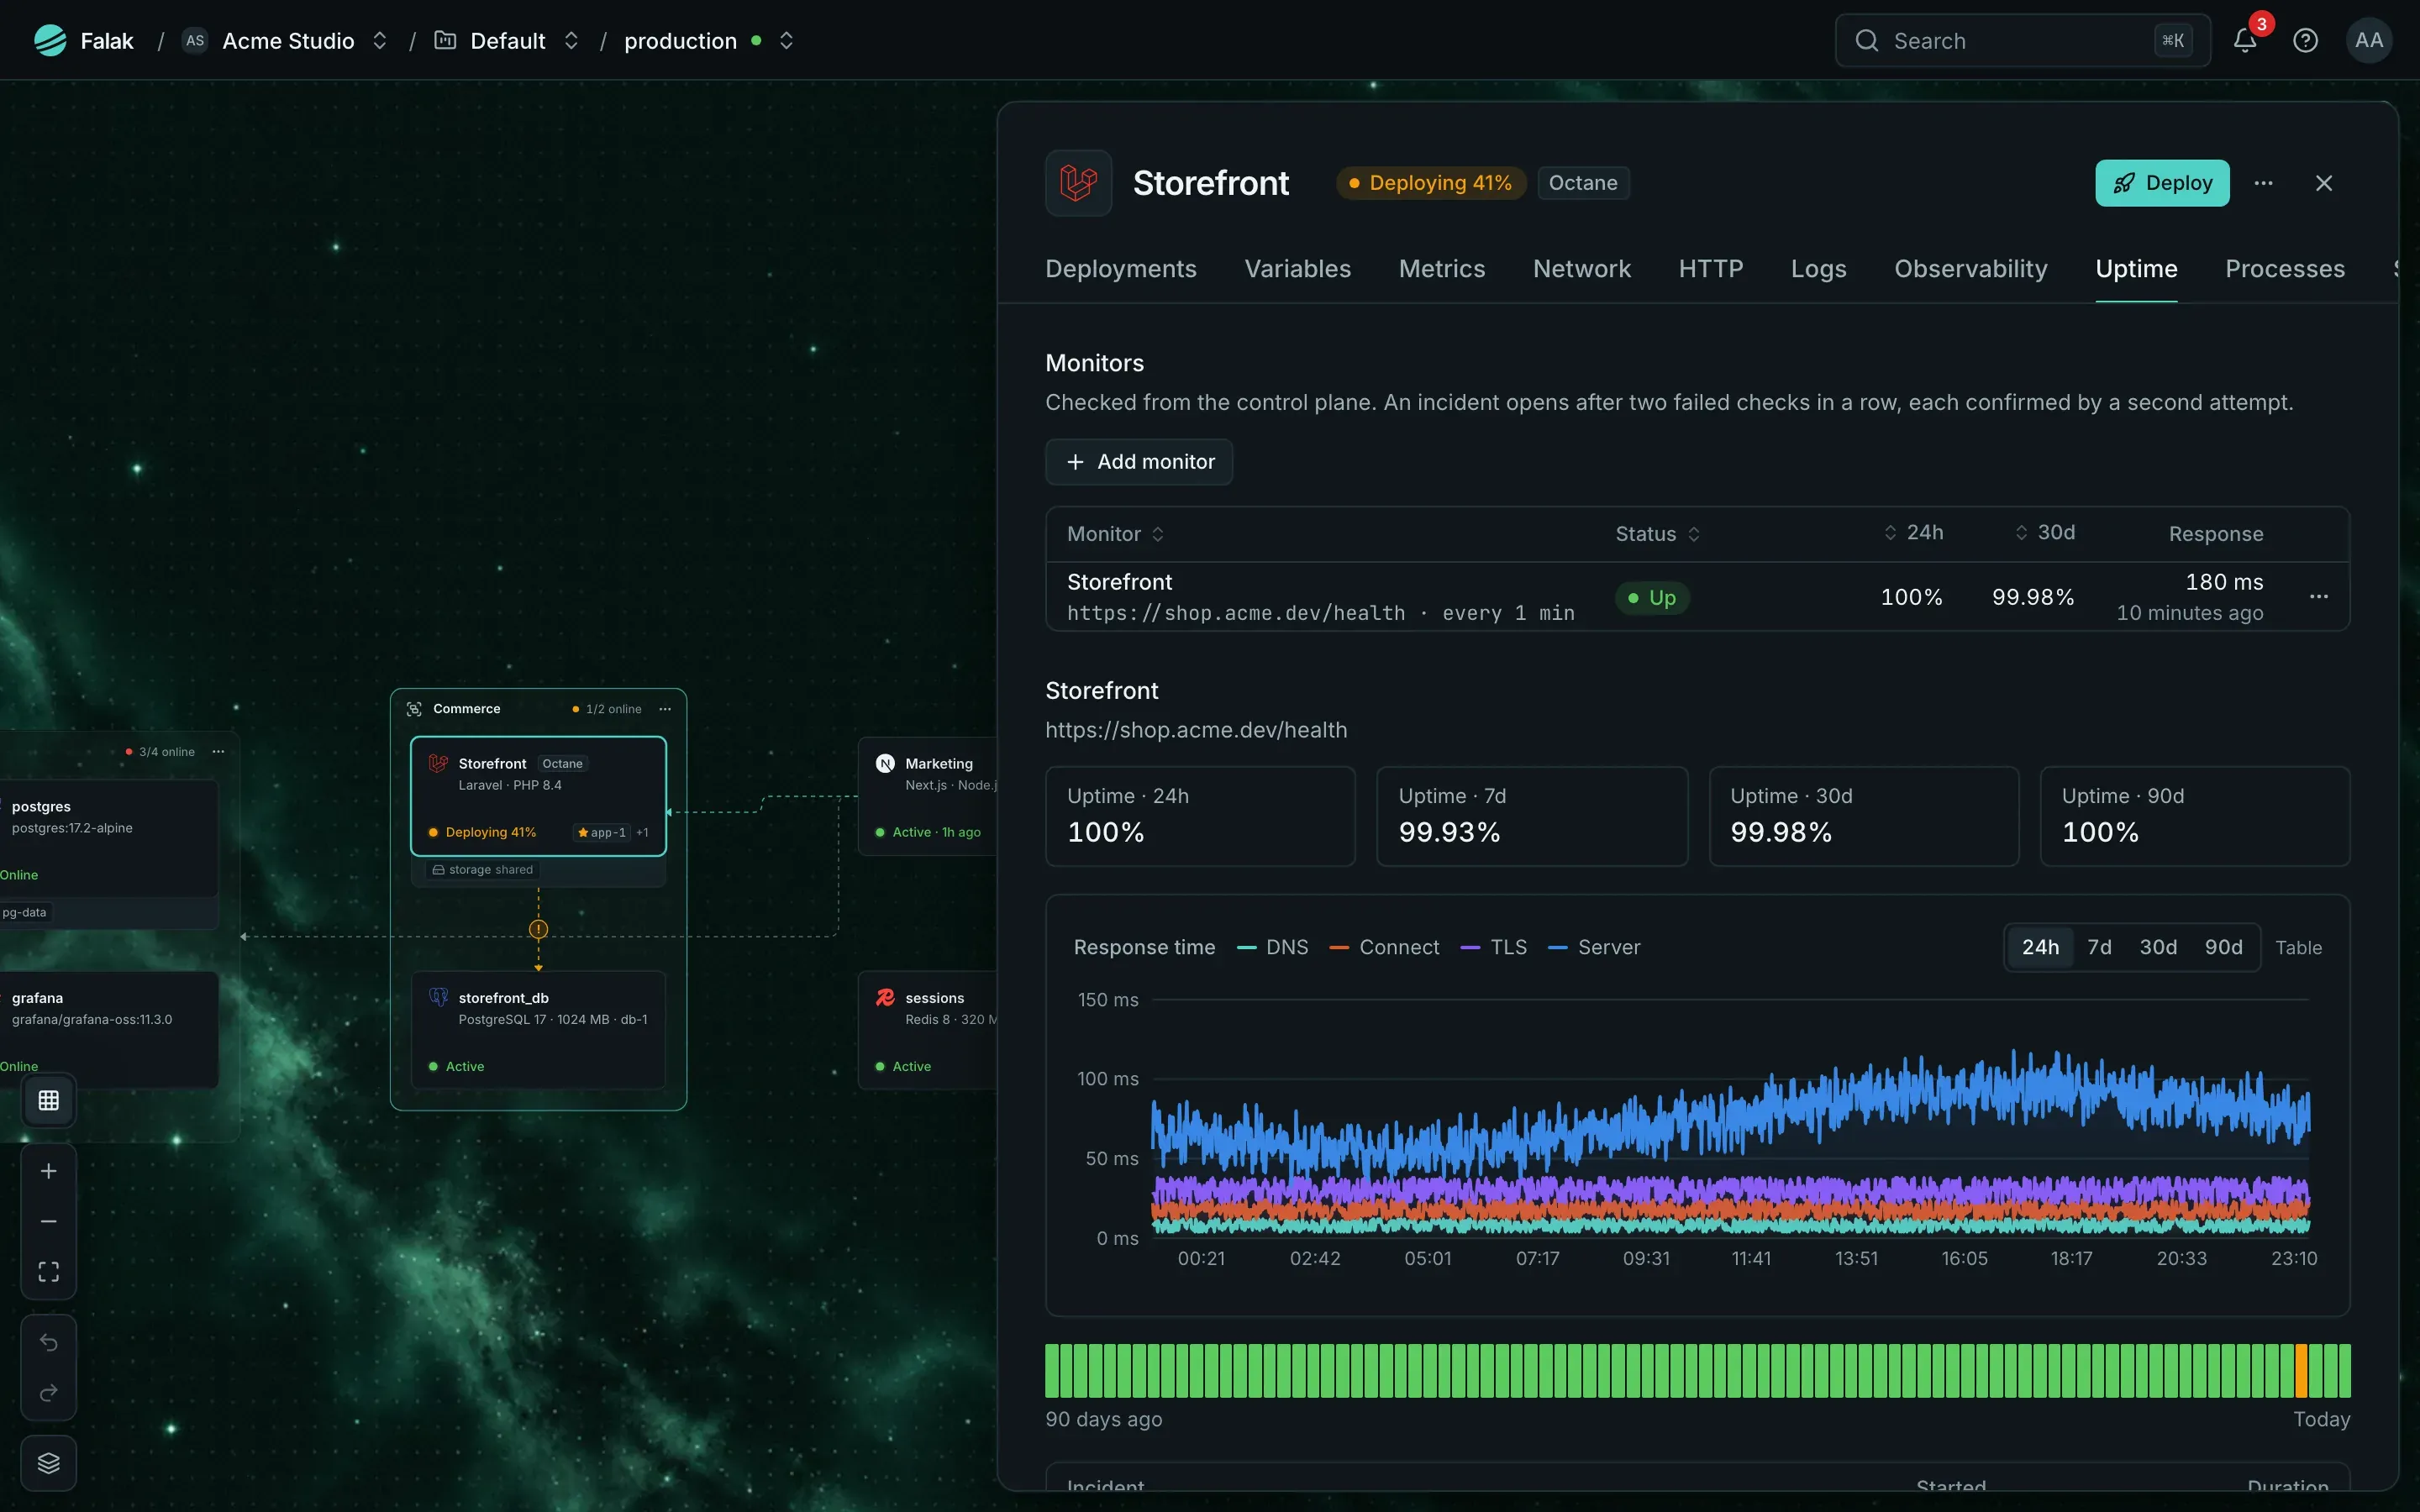
Monitors
Section titled “Monitors”| Type | Target | Succeeds when |
|---|---|---|
http |
http(s)://host[:port]/path (GET) |
The final response’s status matches the expected status (default 2xx,3xx; codes or classes such as 200,301,4xx) and, when set, the body contains a keyword (or does not) within its first 64 KiB |
tcp |
host:port |
The connection is accepted |
tls |
host:port (default 443) |
The TLS handshake succeeds; the certificate chain is then inspected |
Automatic monitors. Every domain of every site, plus its test domain, gets an https://<domain>/ monitor. Preview environments and wildcard domains are left out. A new automatic monitor arms after its first success, so a site that isn’t live yet never alerts (“Waiting for first success”). You can pause and tune them (interval, timeout, expected status, keyword, slow threshold) but not delete or retarget them; removing the domain removes the monitor.
Your own monitors. Any of the three types, optionally attached to a site so they show on its Uptime tab. Up to 50 per organization (automatic monitors don’t count).
| Setting | Default | Range |
|---|---|---|
| Interval | 60 s | 30 s – 10 min |
| Timeout (whole attempt, redirects included) | 10 s | 1–20 s |
| Redirects followed | 5 | 0 = a redirect is the final answer |
| Slow threshold | 3,000 ms |
Checks, incidents and uptime
Section titled “Checks, incidents and uptime”- A failed check is retried once after a second; only two failures in a row count. After a failure, the next check comes within 30 s so an outage is confirmed quickly.
- An incident opens after 2 failed checks in a row and closes after 2 successful ones, with its duration and cause.
- Uptime % (24 h, 7 d, 30 d, 90 d) is weighted by time, not by check count. Paused monitors don’t count.
- Each check records DNS, connect, TLS, time to first byte and total time. TLS checks (and
httpsmonitors once an hour) report an expired certificate, a hostname mismatch, an untrusted or self-signed certificate, or a missing intermediate. - A monitor that flaps (3 incidents within an hour) stays “down” for alerting until it has been up for 15 minutes, so you get one recovery, not ten.
- Control plane offline: when a check fails, Falak also checks its own connectivity. If that fails too, the check is recorded as unknown and changes nothing, instead of opening incidents everywhere.
Checks are kept 7 days, hourly figures 30 days, daily figures and incidents 90 days.
Where to look
Section titled “Where to look”- Site → Uptime (
uptime.view): the site’s monitors, uptime %, response-time chart, 90-day bars, incidents and recent failed checks. - Observability → Uptime: every monitor of the organization, with filters, summary counts and recent incidents. Create your own monitors here.
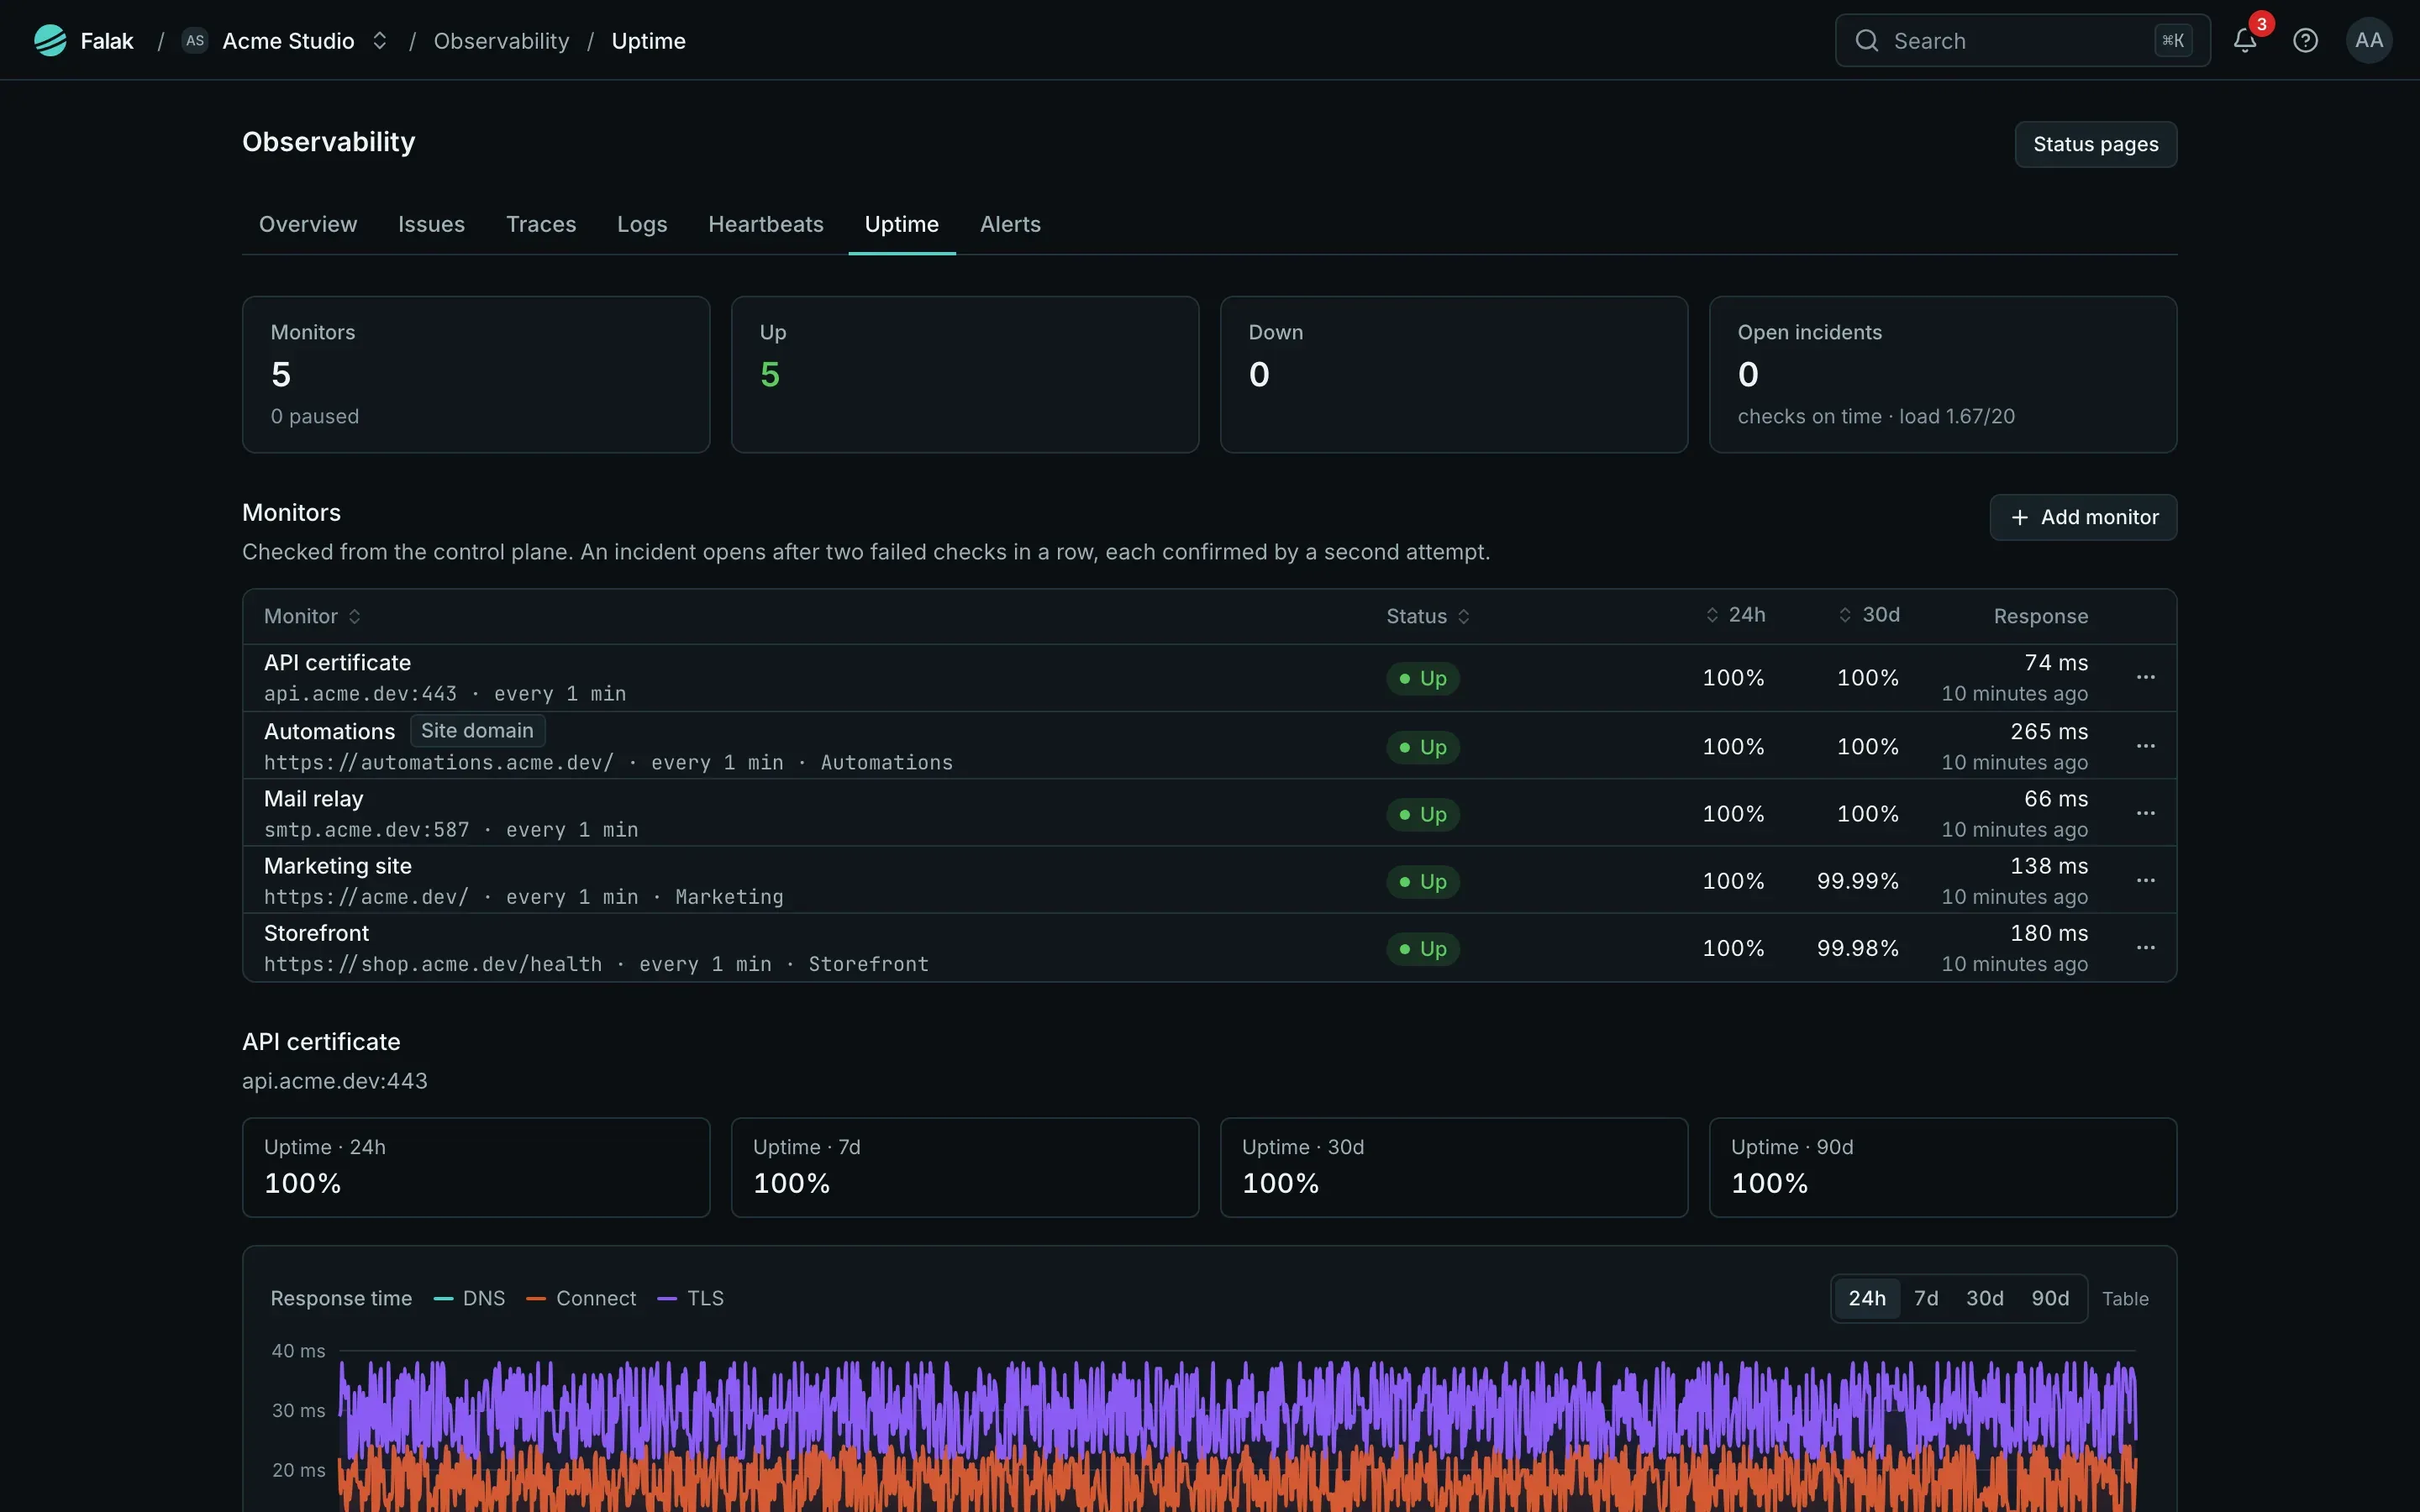
Outages and certificate problems are also uptime Issues in Insights: one Issue per monitor counts its outages.
Alerts
Section titled “Alerts”| Type | Severity | When |
|---|---|---|
uptime.monitor_down |
critical | An incident opens |
uptime.monitor_recovered |
info | It closes |
uptime.tls_problem |
warning | Broken chain, hostname mismatch, expired certificate, or (your own monitors) expiry within 14 days. Automatic monitors leave “expires soon” to edge.certificate_expiring. |
uptime.slow |
warning | The median of the last 5 checks is above the slow threshold for 5 minutes |
uptime.checks_delayed |
warning | The organization’s checks have been running 2 minutes late for 5 minutes |
Status pages
Section titled “Status pages”A public page at https://<panel>/status/<slug>, opt-in per project.
- Open Observability → Uptime → Status pages (needs
uptime.publish, admins). - Pick a project, an address and a title, then add monitors and type the display name each one shows.
- Enable the page.
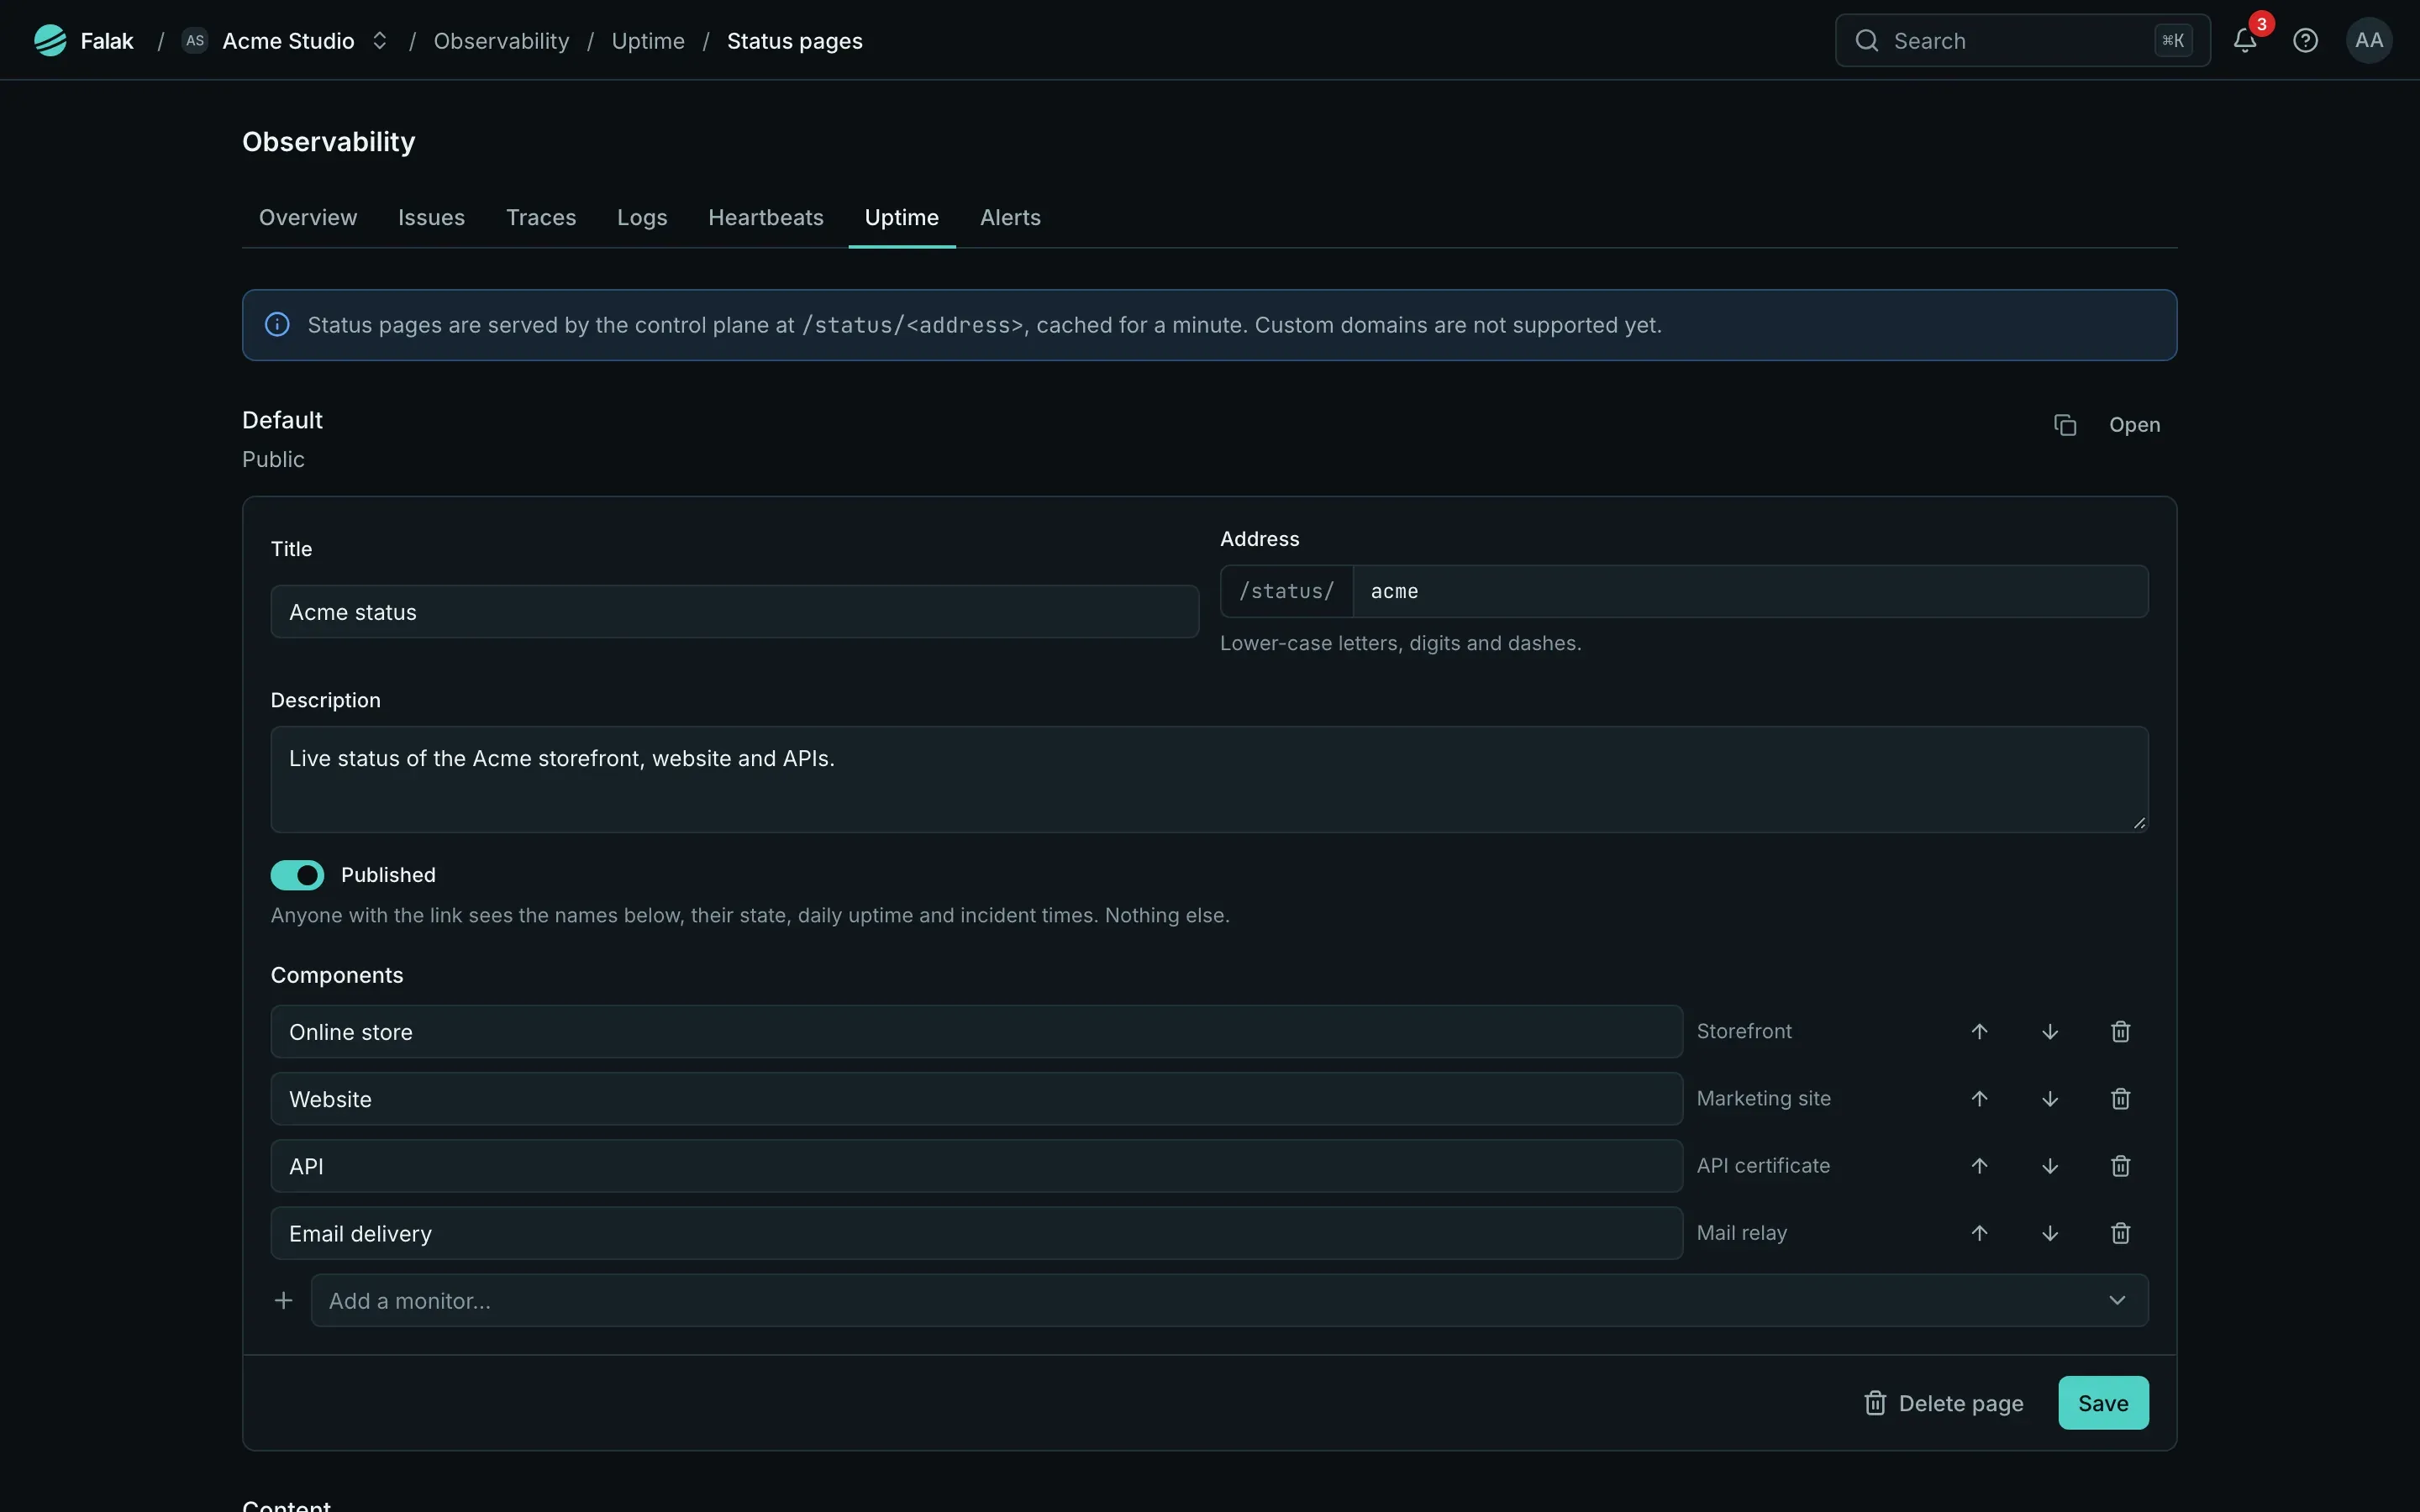
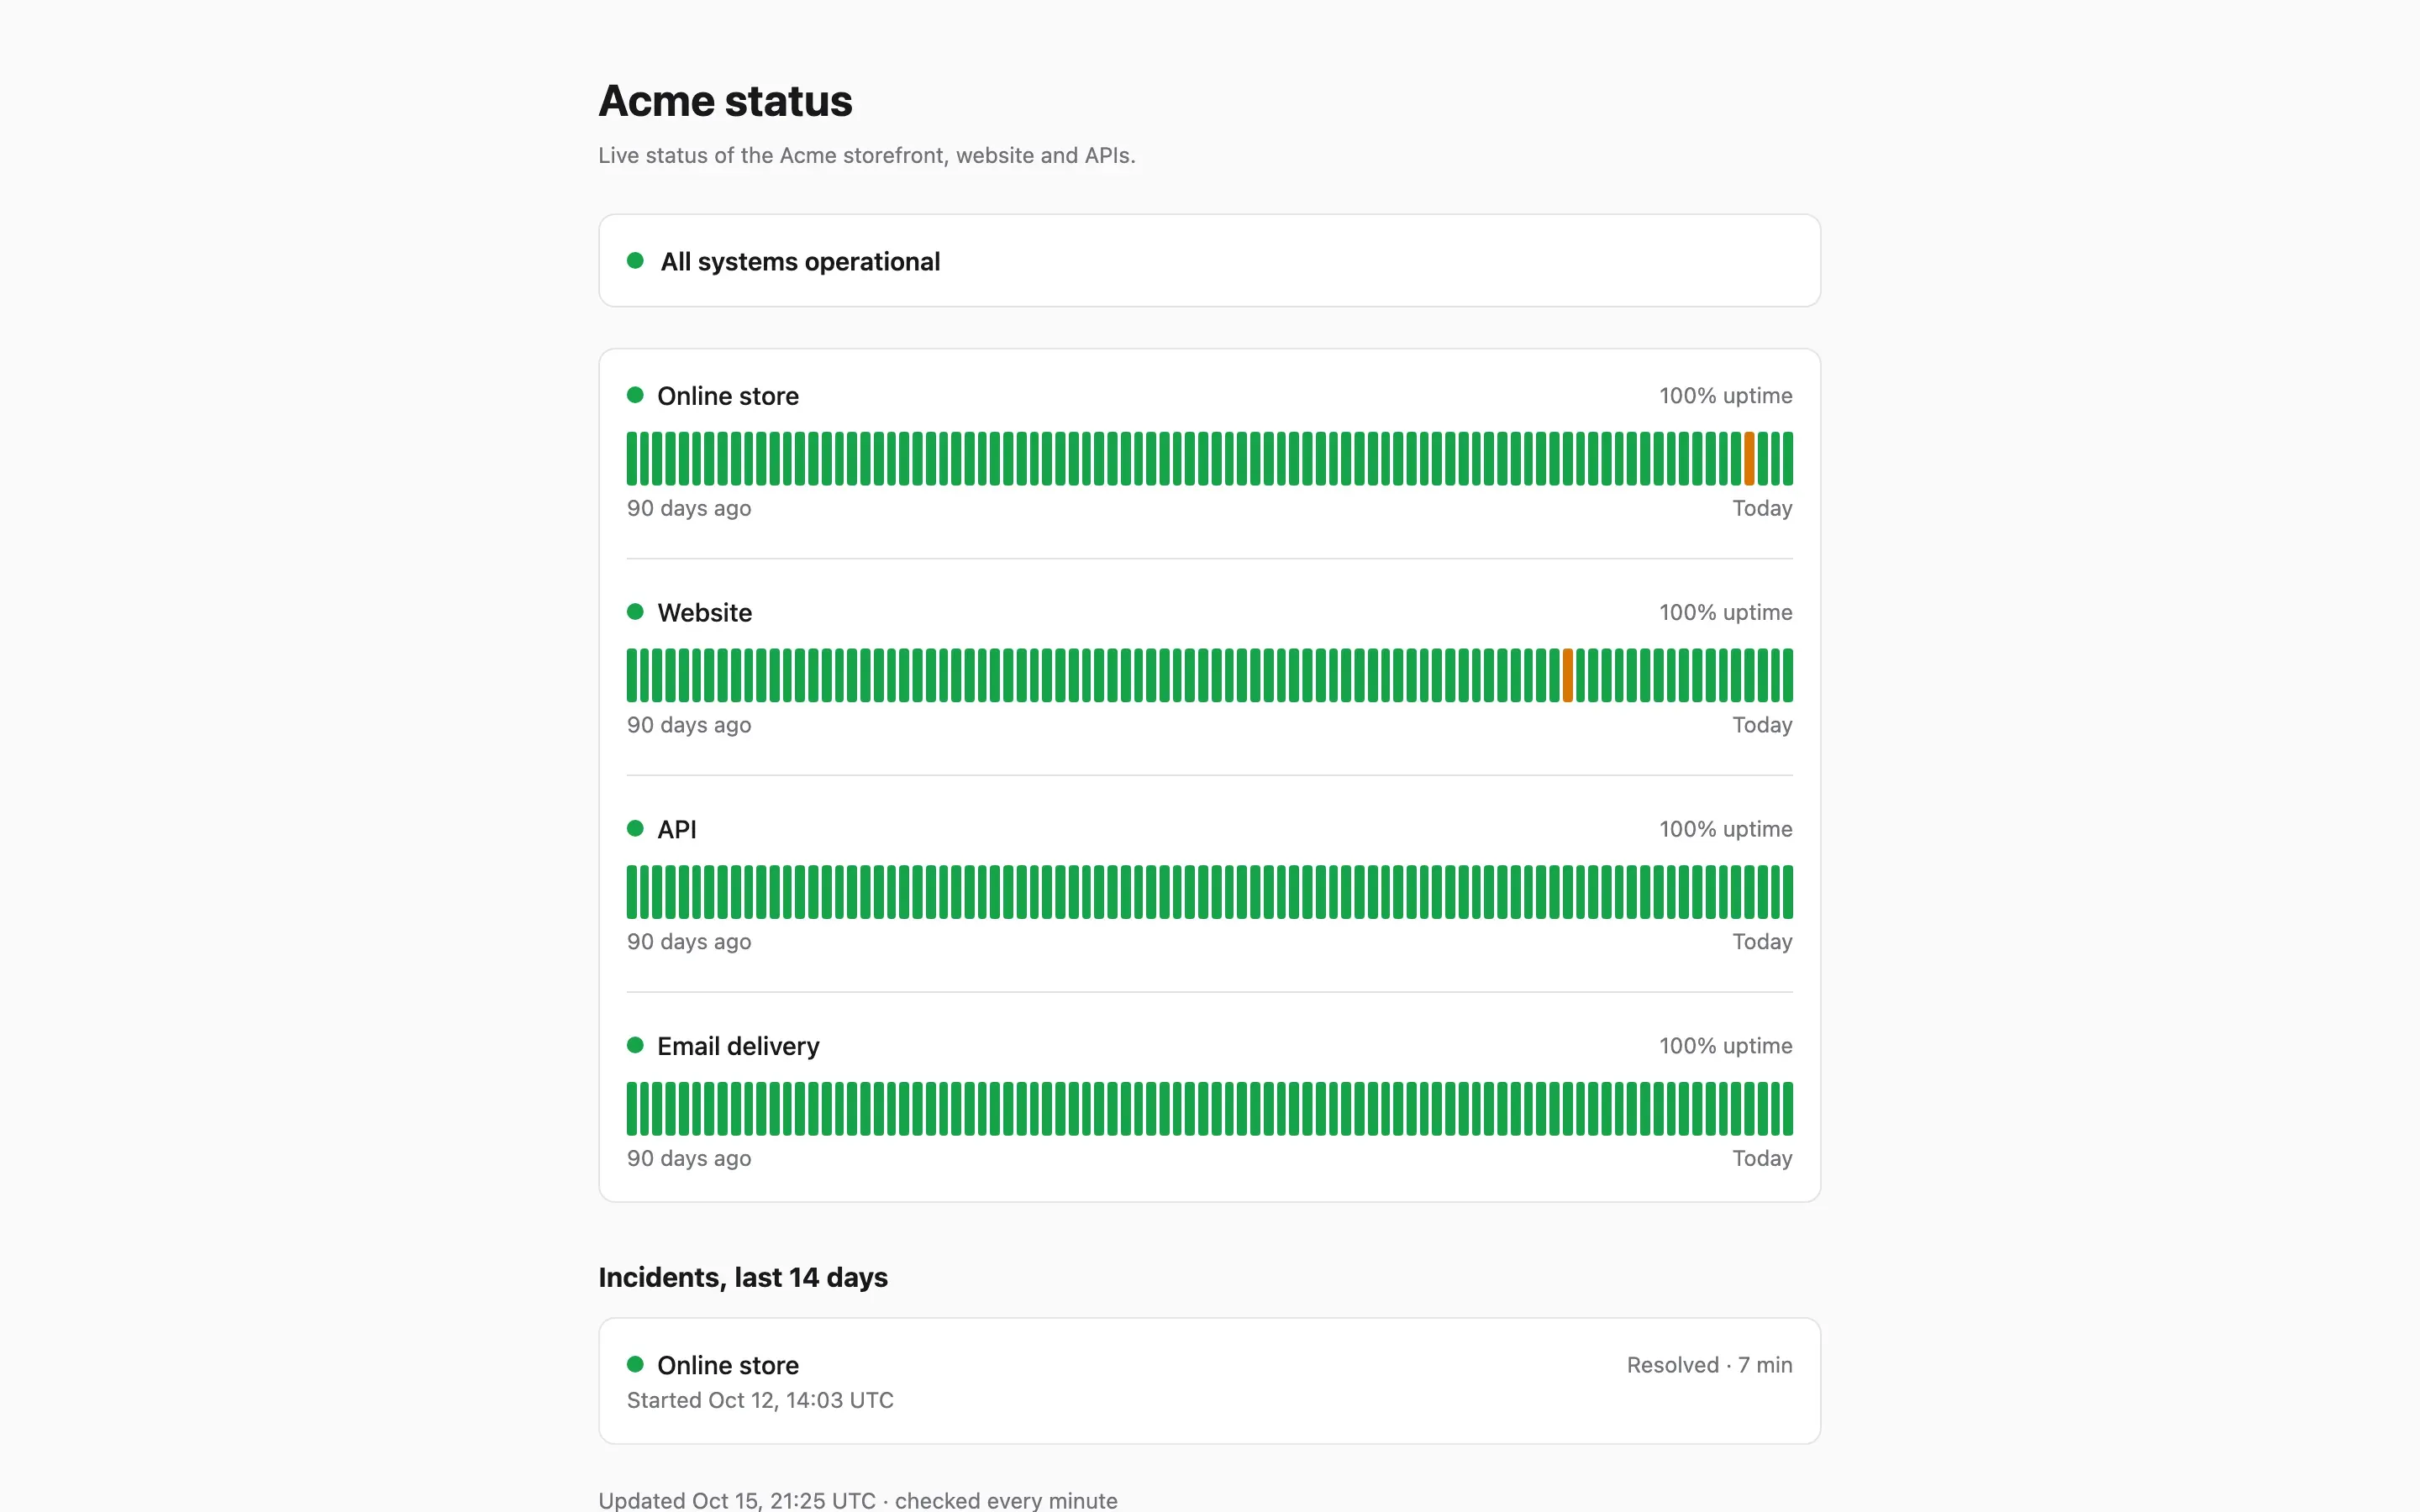
The page shows only what you typed: no URLs, hosts, addresses, errors or status codes. It lists each monitor’s state, 90 daily bars and the incidents of the last 14 days. It sets no cookies, runs no app JavaScript, is cached for 60 seconds and rate limited per IP. Reserved words and well-known brand names can’t be used as addresses. Custom domains for status pages are not supported yet.
Safety
Section titled “Safety”- Each organization’s checks are budgeted (at most 2 in flight, and a load budget for intervals and timeouts), so one organization can’t slow down the others. Checks run on their own queue workers (
FALAK_UPTIME_WORKERS, 4), never delaying deploys. - Every check comes from the control plane’s location: a network problem between the control plane and a site looks like an outage, and problems elsewhere are invisible.
- No multi-step or browser checks, ICMP, DNS record checks, POST bodies or custom headers.
Permissions
Section titled “Permissions”| Permission | Grants | Roles |
|---|---|---|
uptime.view |
View monitors, incidents and status pages | admin, developer, viewer |
uptime.manage |
Create, change, pause and delete monitors | admin, developer |
uptime.publish |
Publish public status pages | admin |