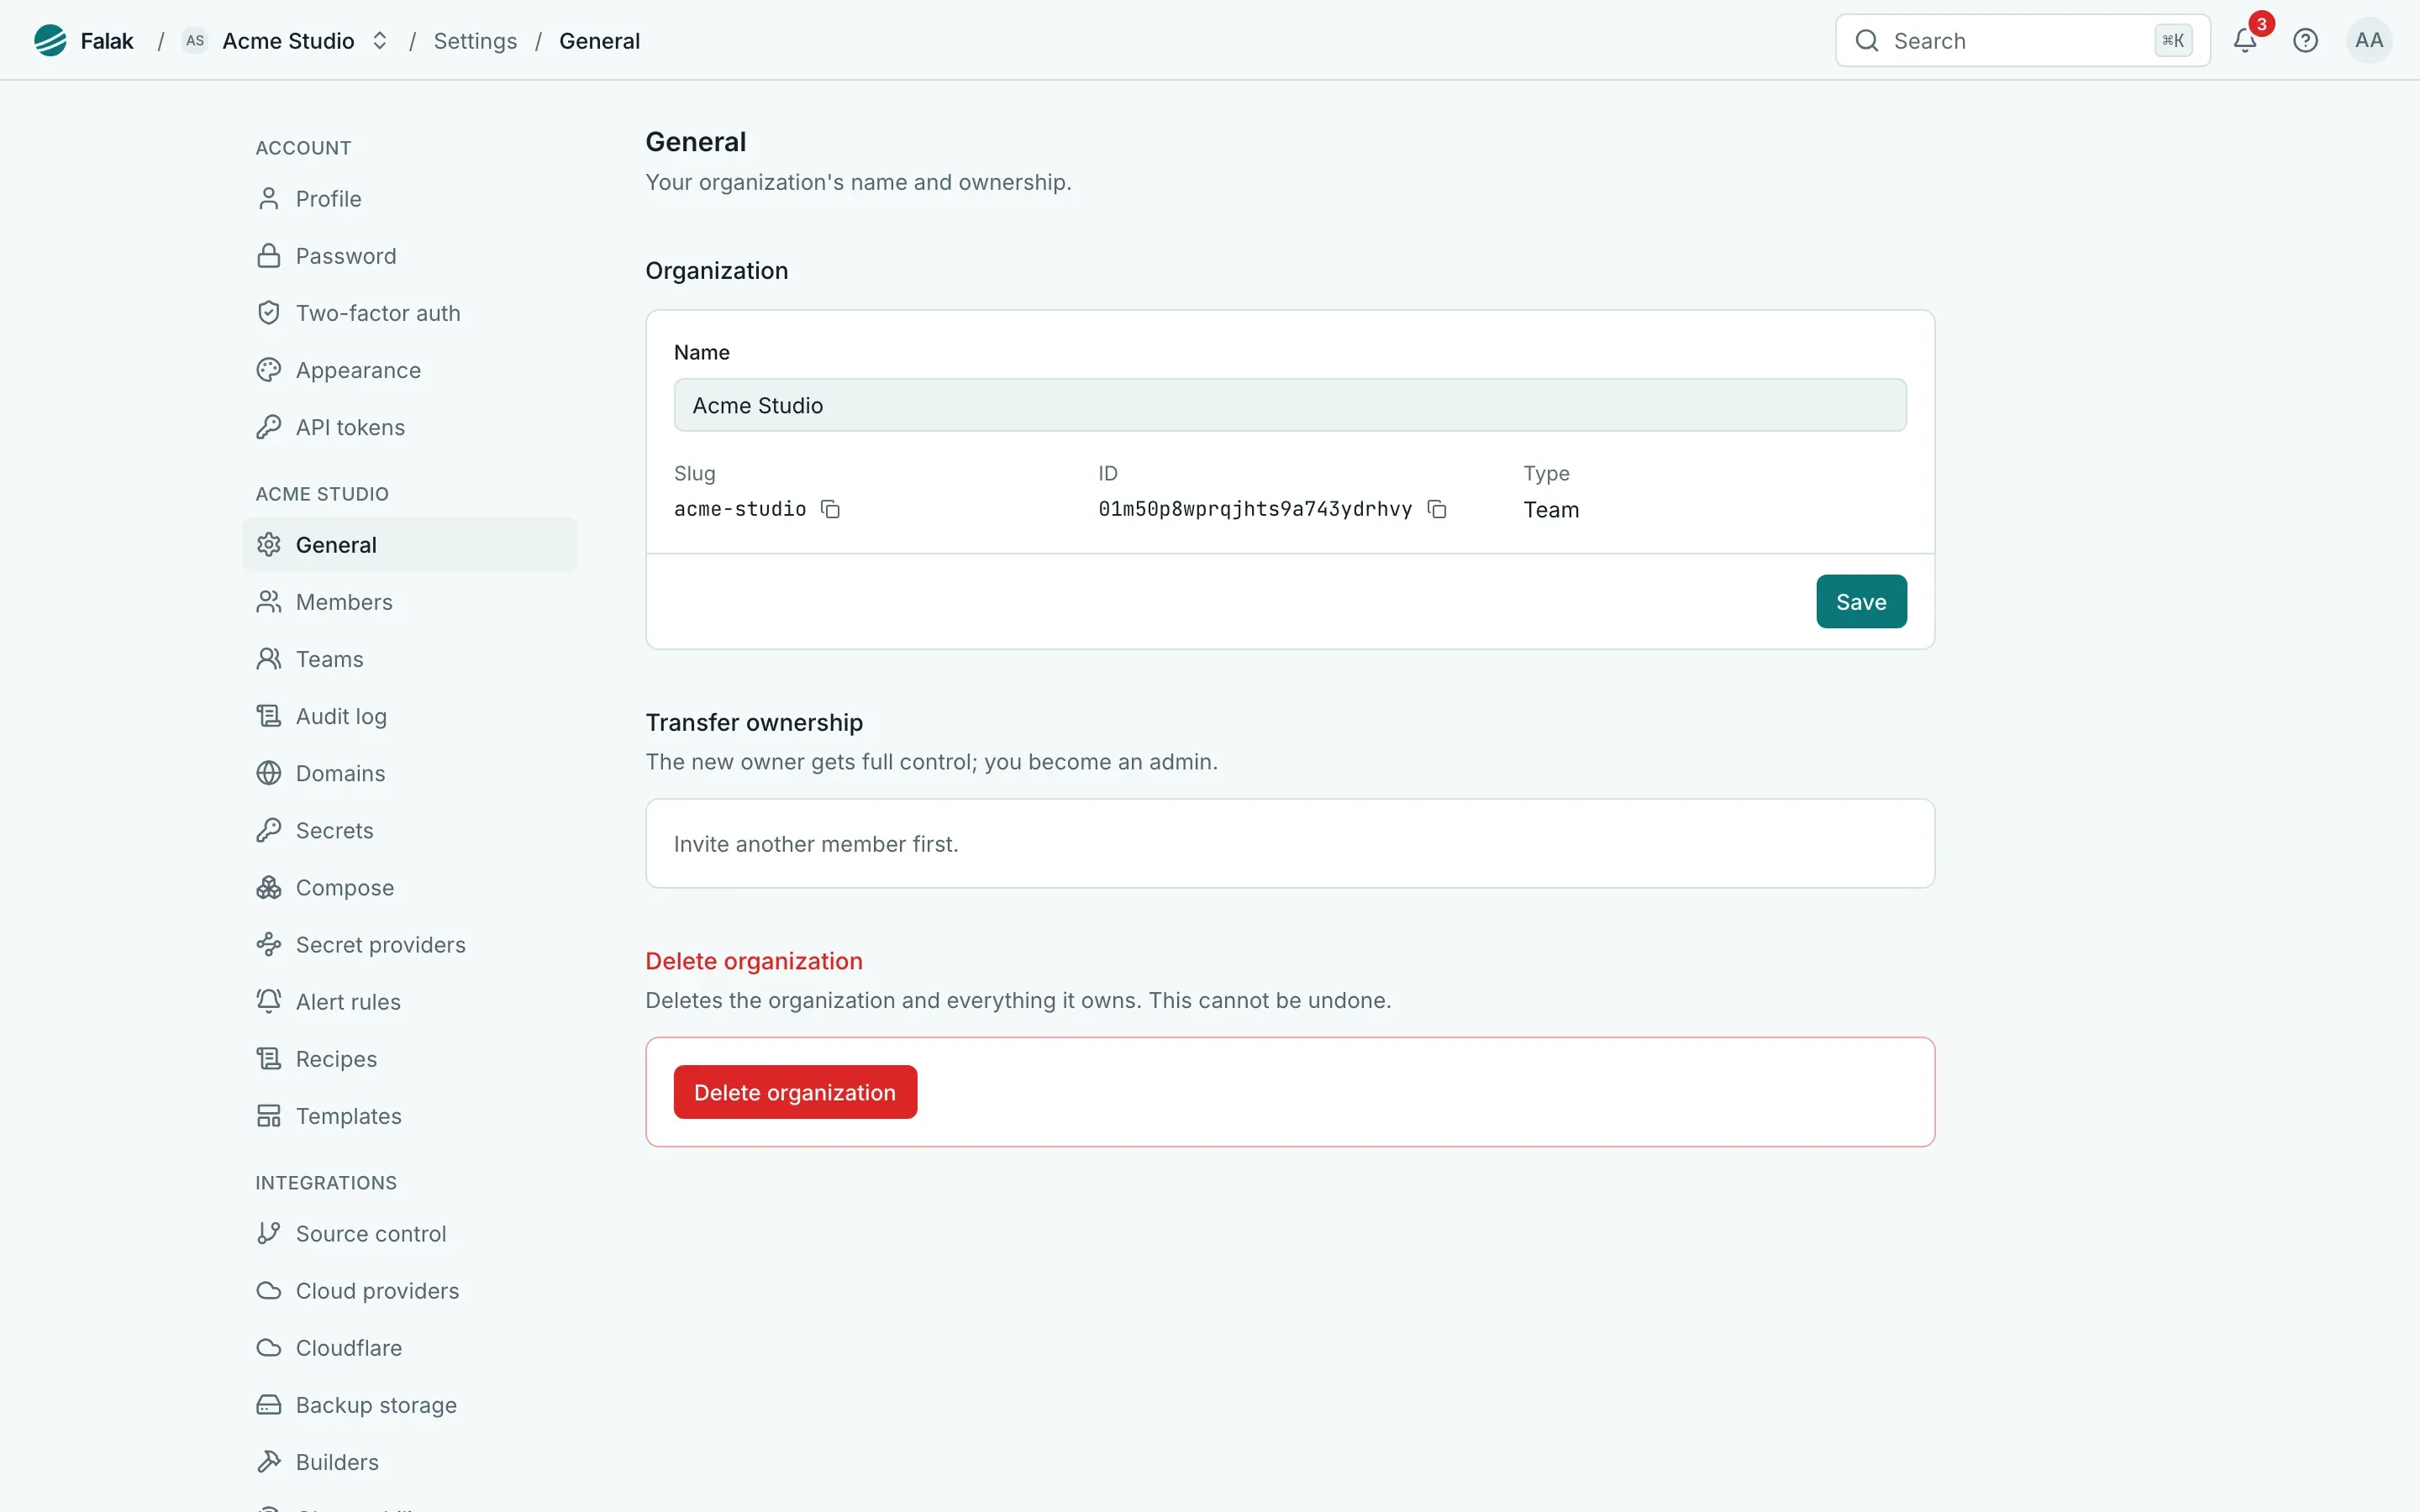
UI walk-through
A tour of the Falak panel, from a project’s canvas to the settings. The screenshots come from a local demo installation (v0.19.0) filled with sample data: the “Acme Studio” organization, its servers and its sites are not real.
The canvas
Section titled “The canvas”Every project opens on a canvas of its services for one environment: sites, compose stacks, functions, databases and Redis / Valkey instances. Cards show each service’s status, the server it runs on and its volumes; dashed lines show which service references which. Groups such as Commerce collect related services.
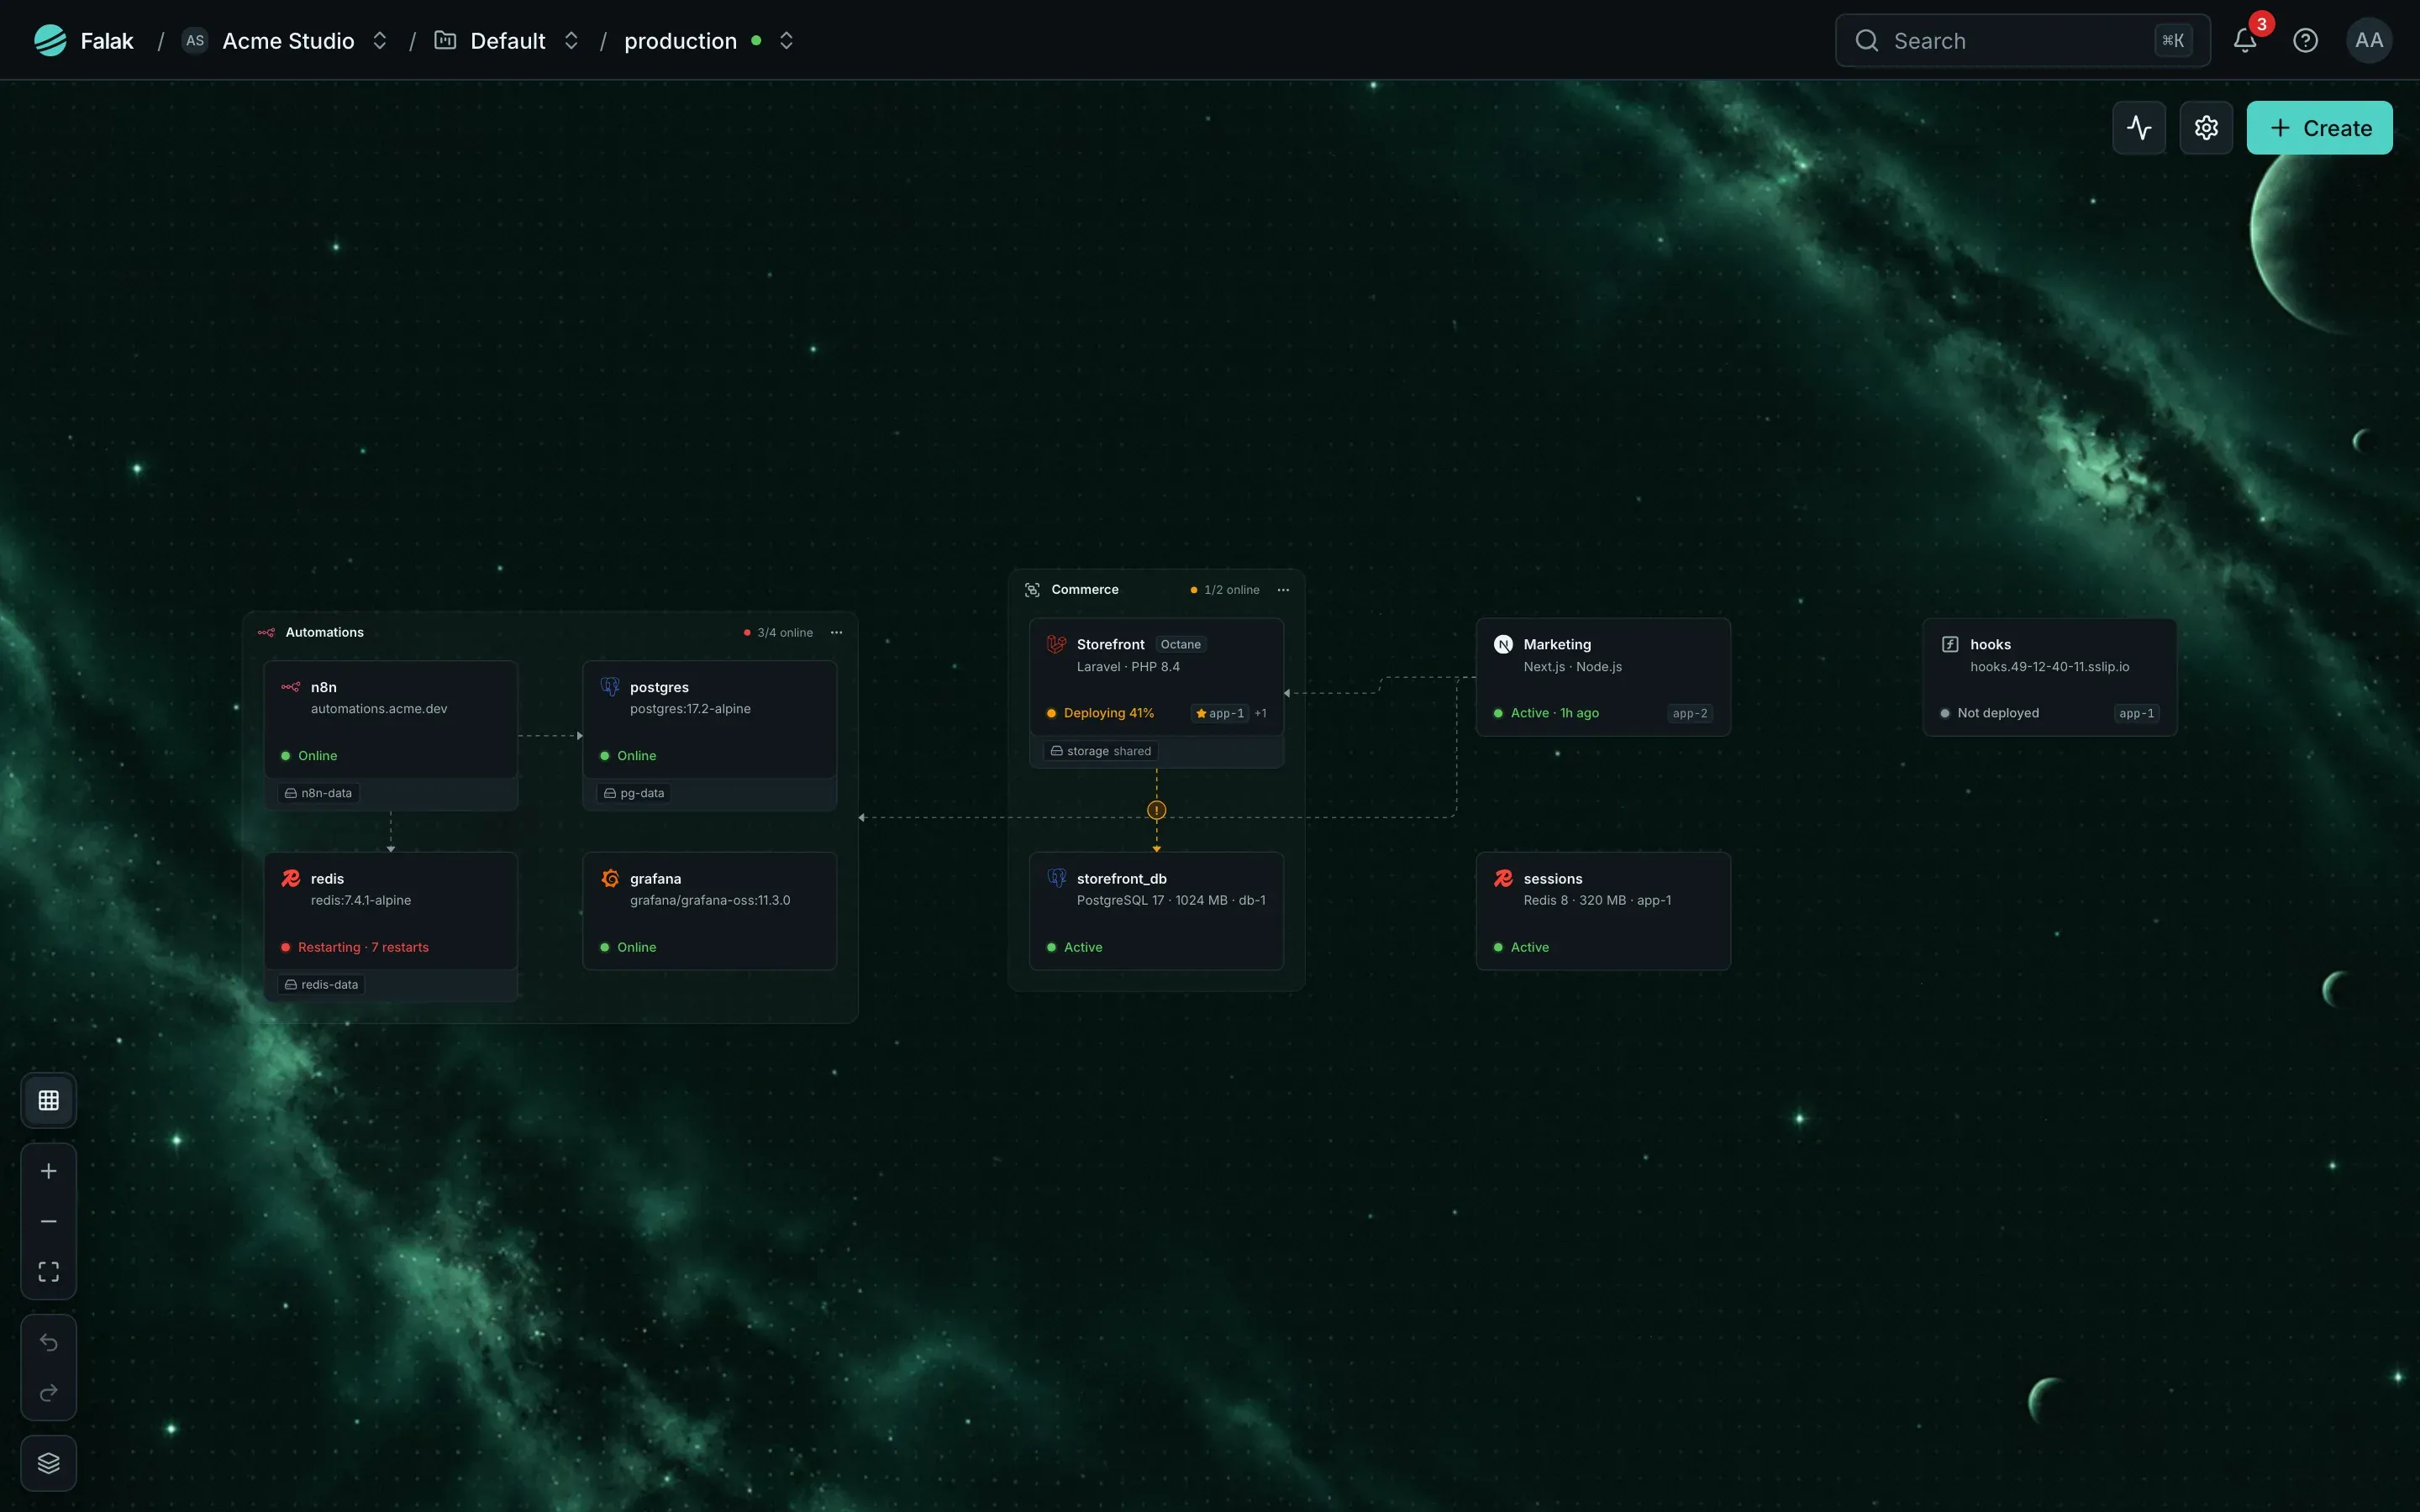
The breadcrumbs at the top switch the organization, the project and the environment. ⌘K searches everything. In light mode the backdrop turns into pale ink:
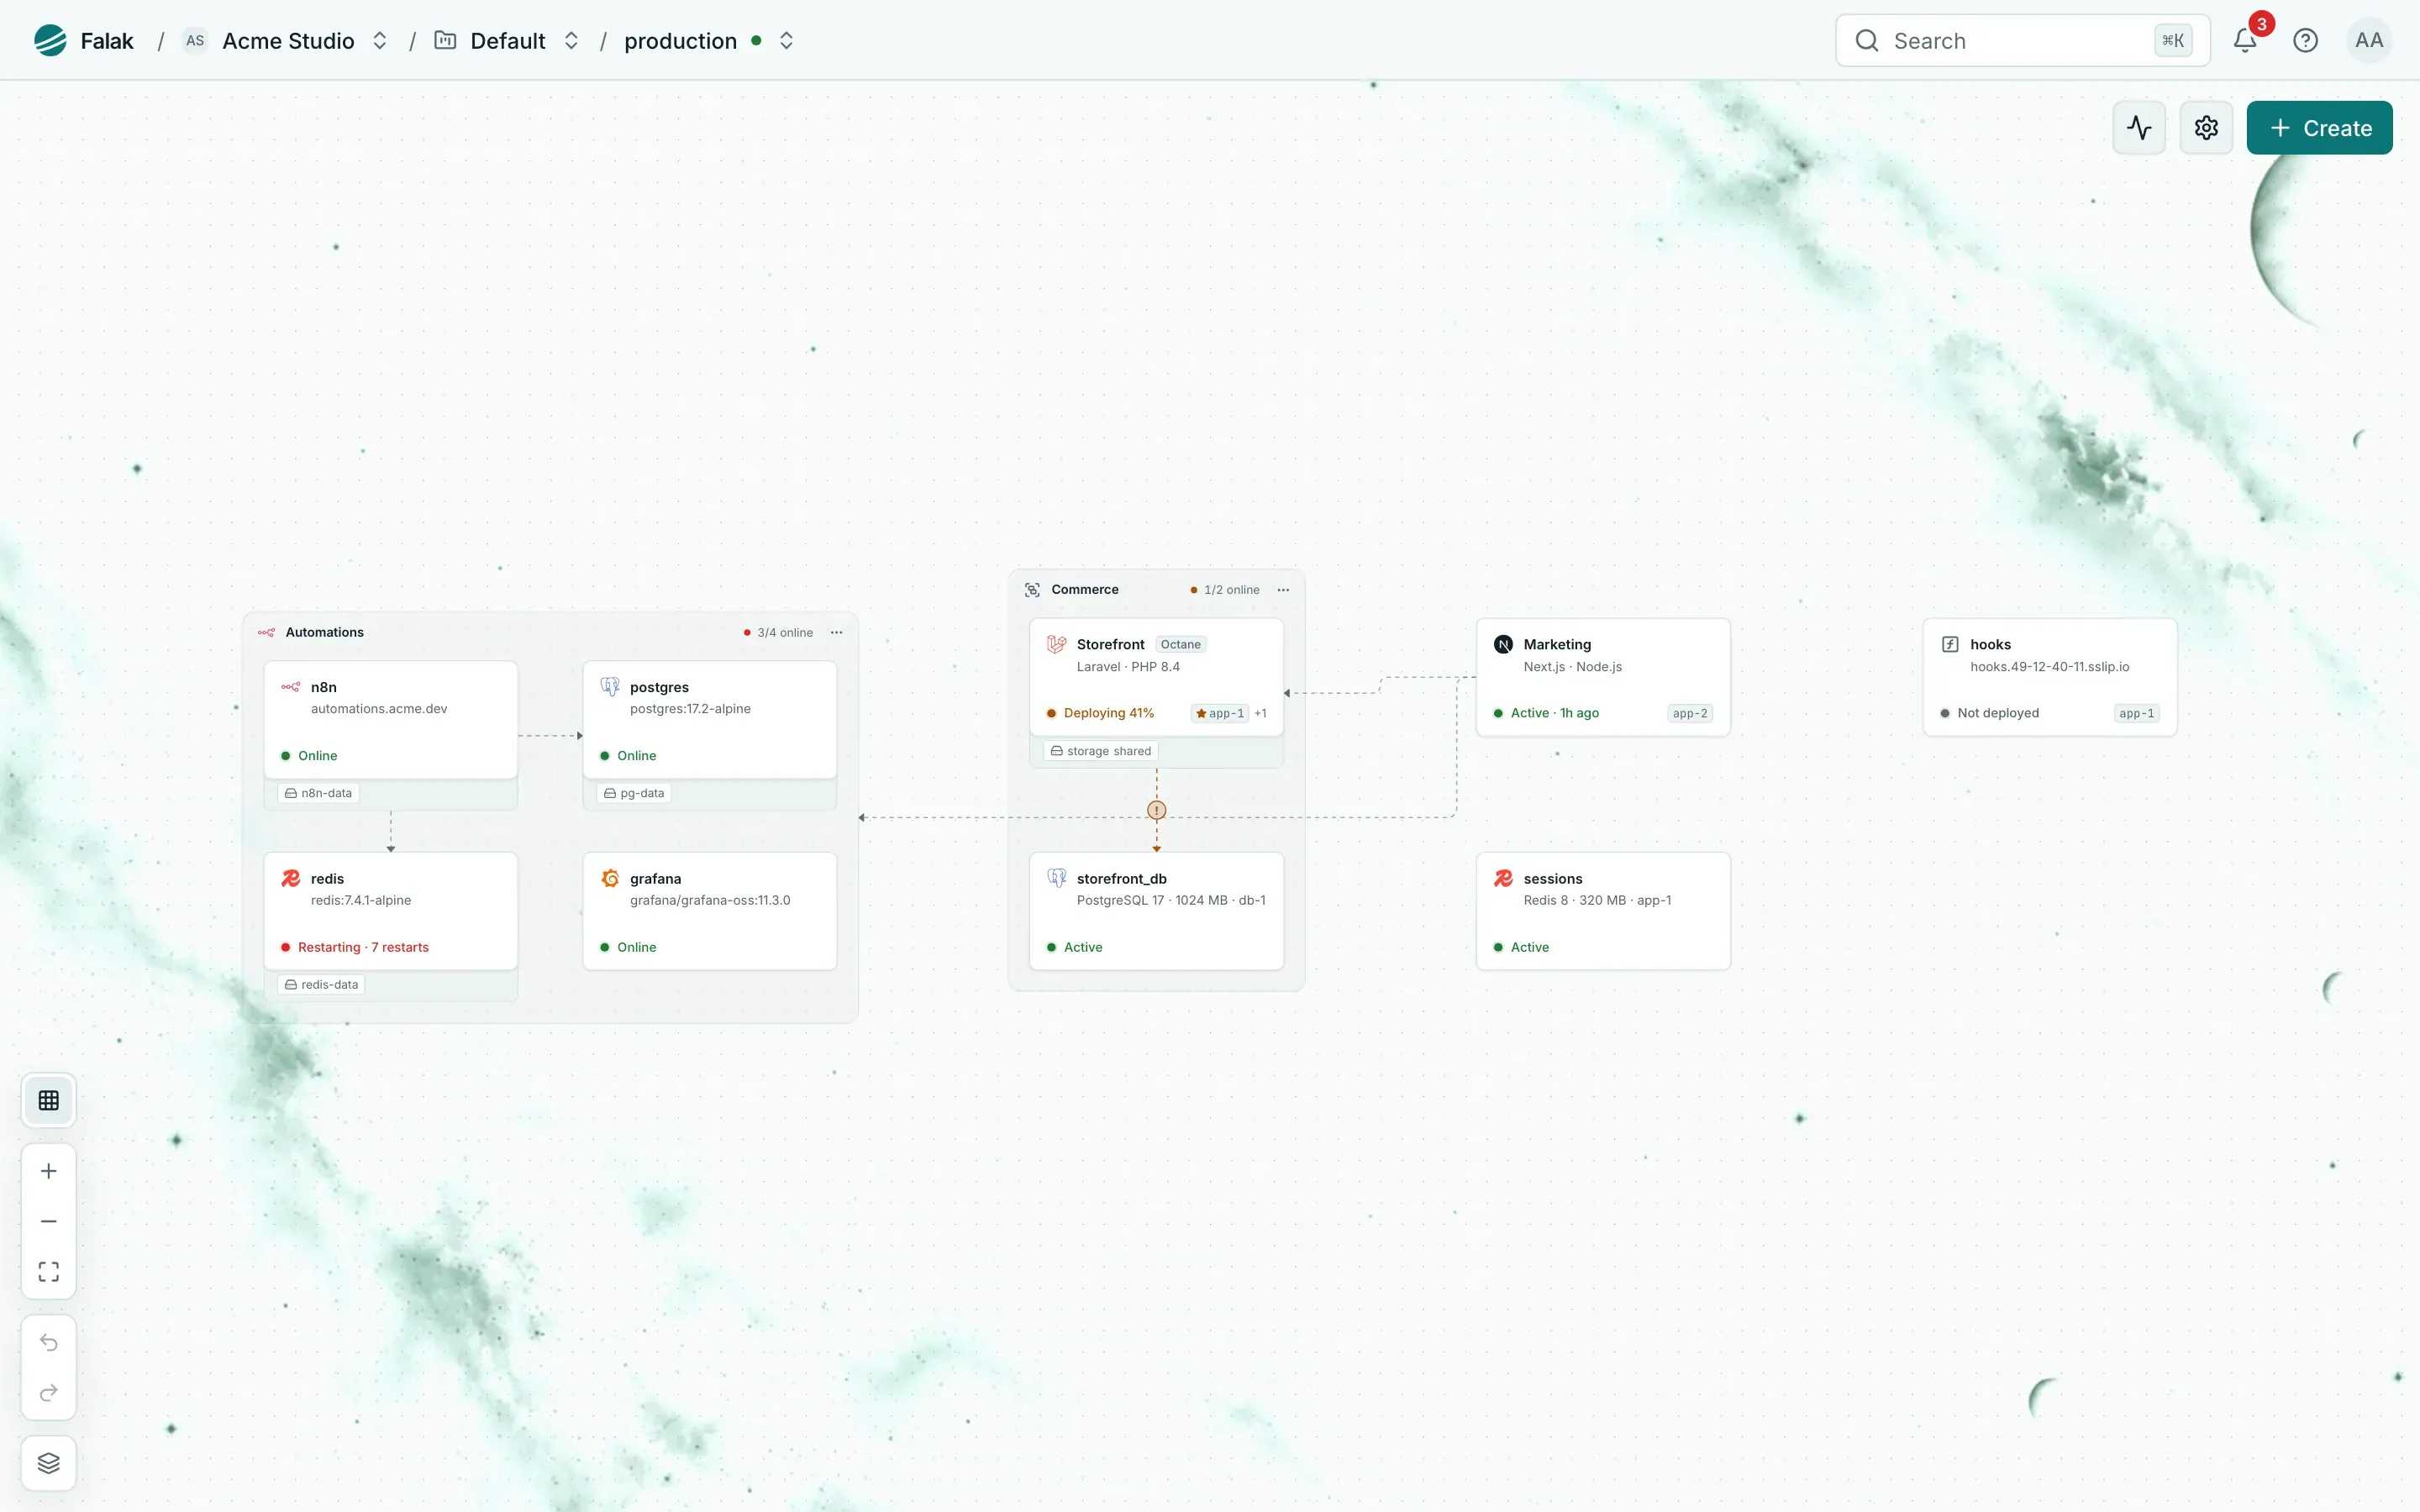
See Projects and environments.
Create anything from the keyboard
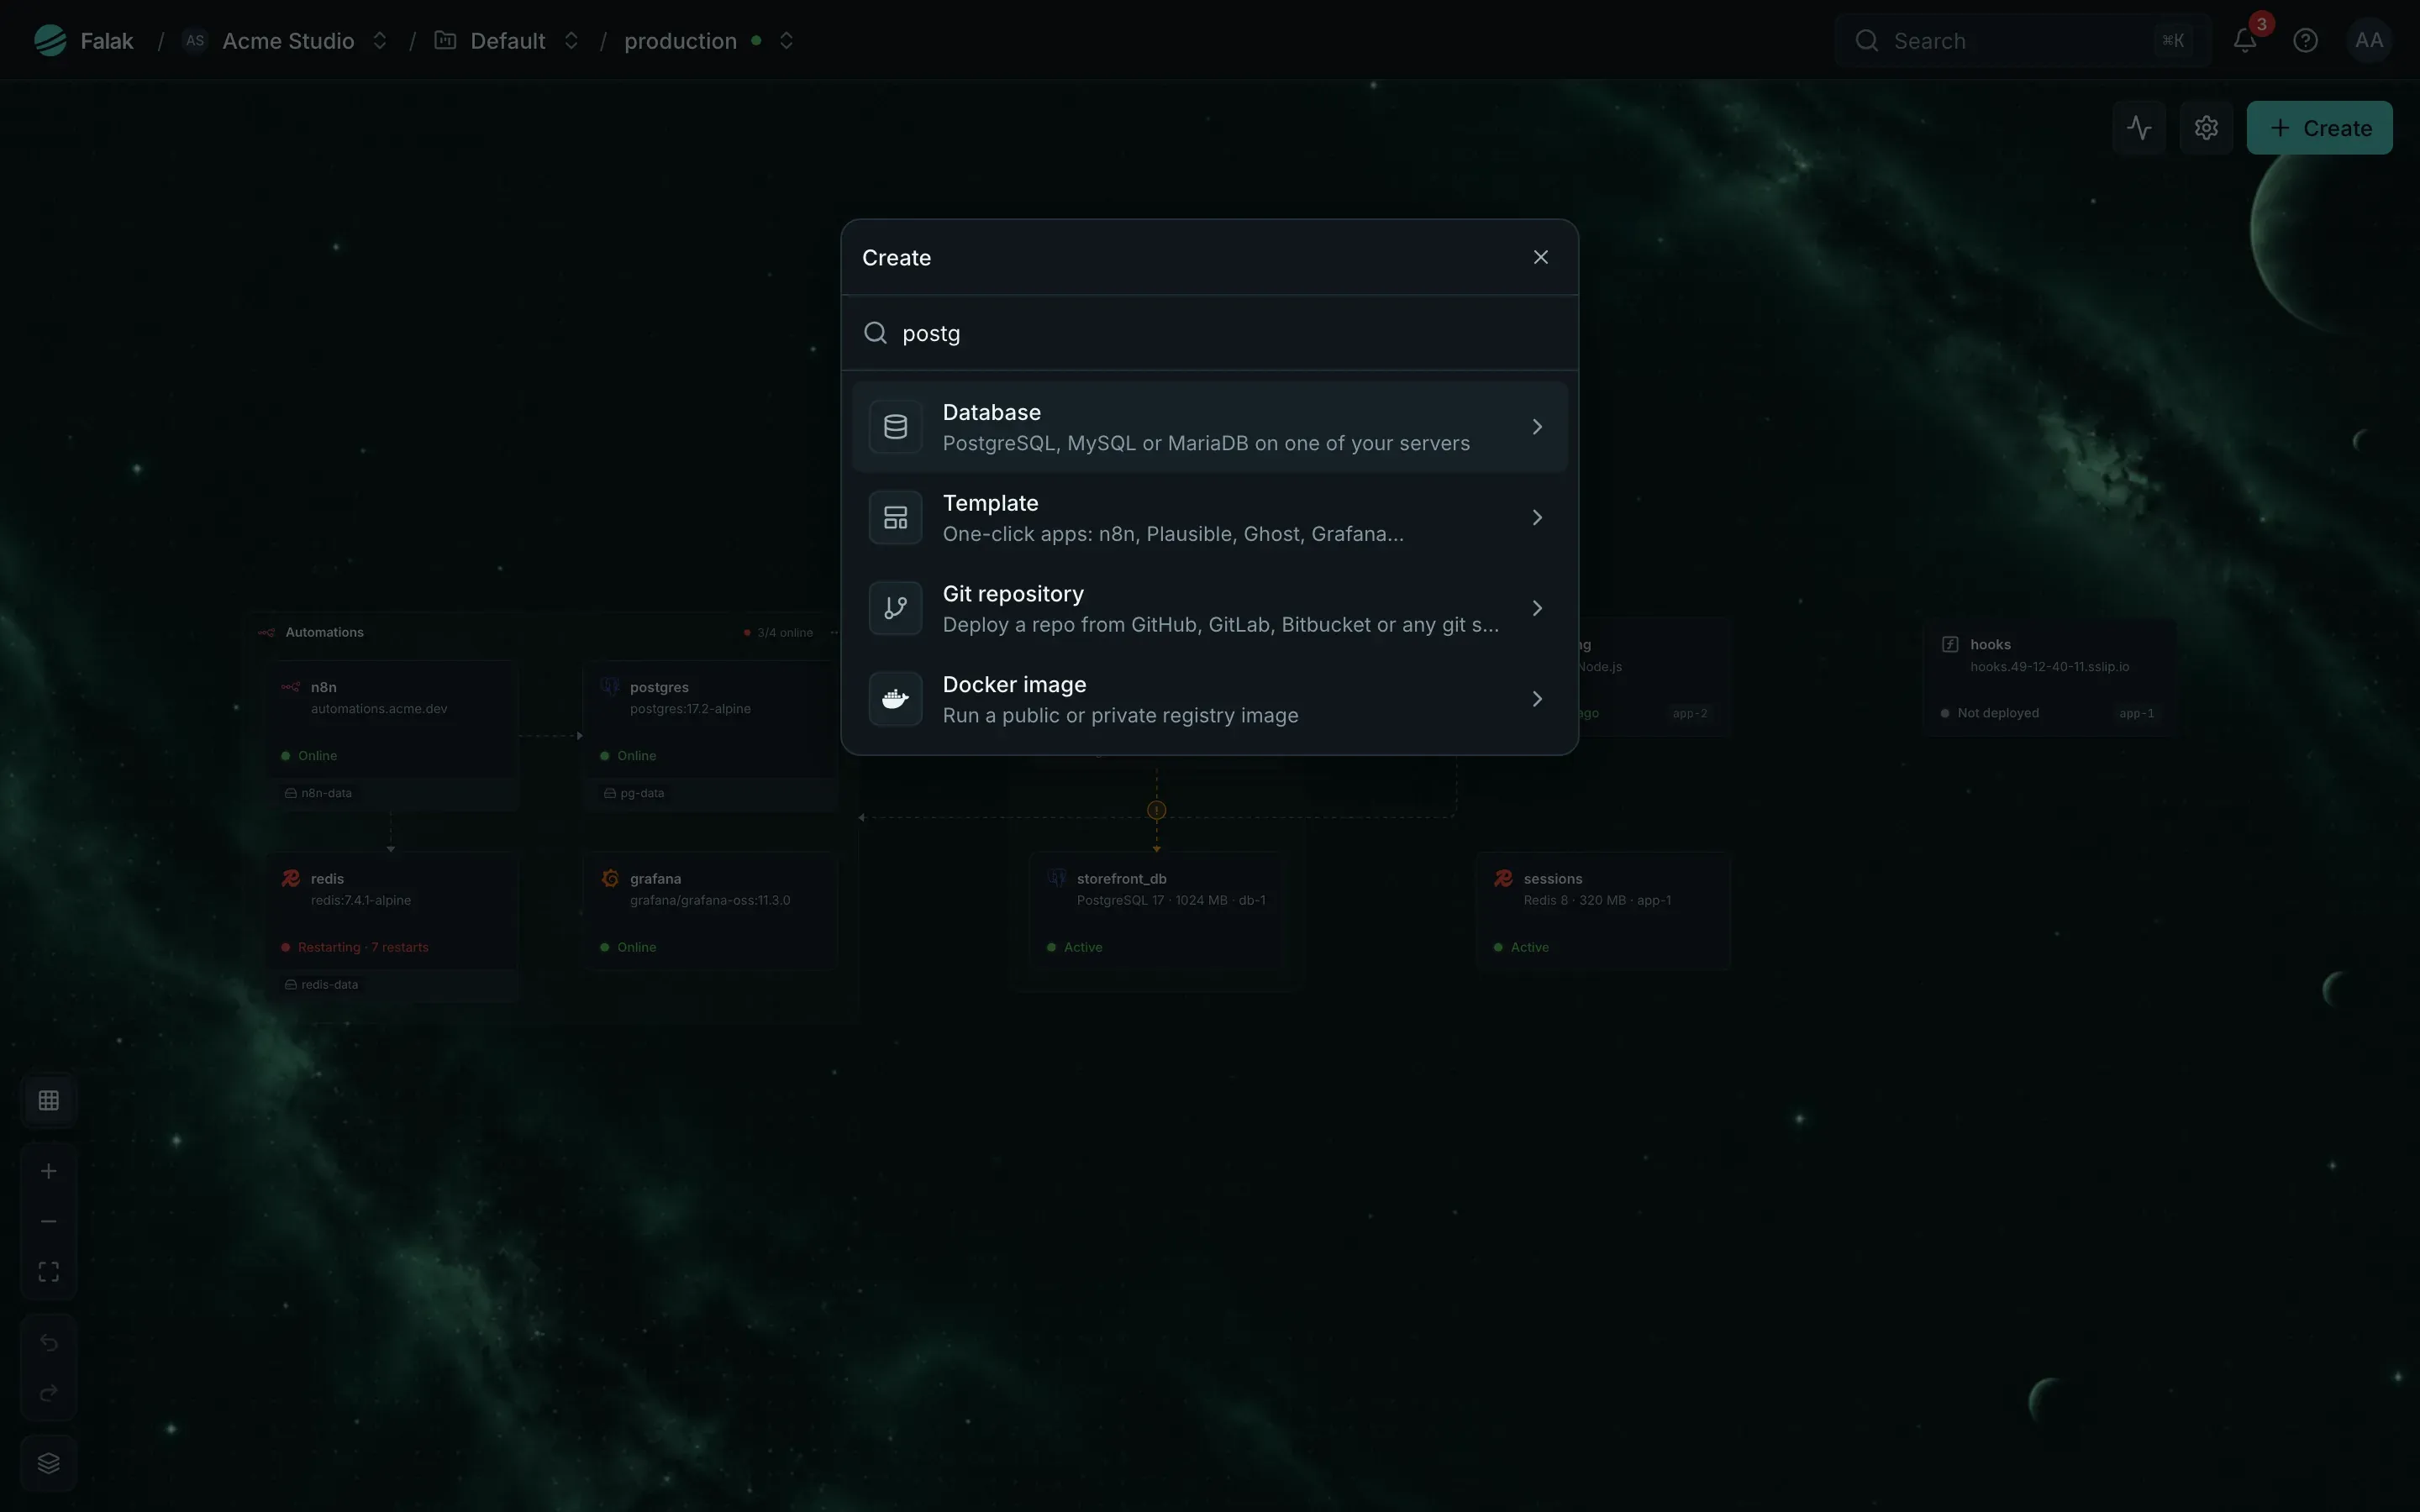
Section titled “Create anything from the keyboard”Create opens a centered picker. It is one keyboard list at every step: type to filter, move with the arrow keys (Home and End jump), press Enter to go in, and Esc (or Back) to go up one level. Focus stays in the picker and returns to the button when it closes.
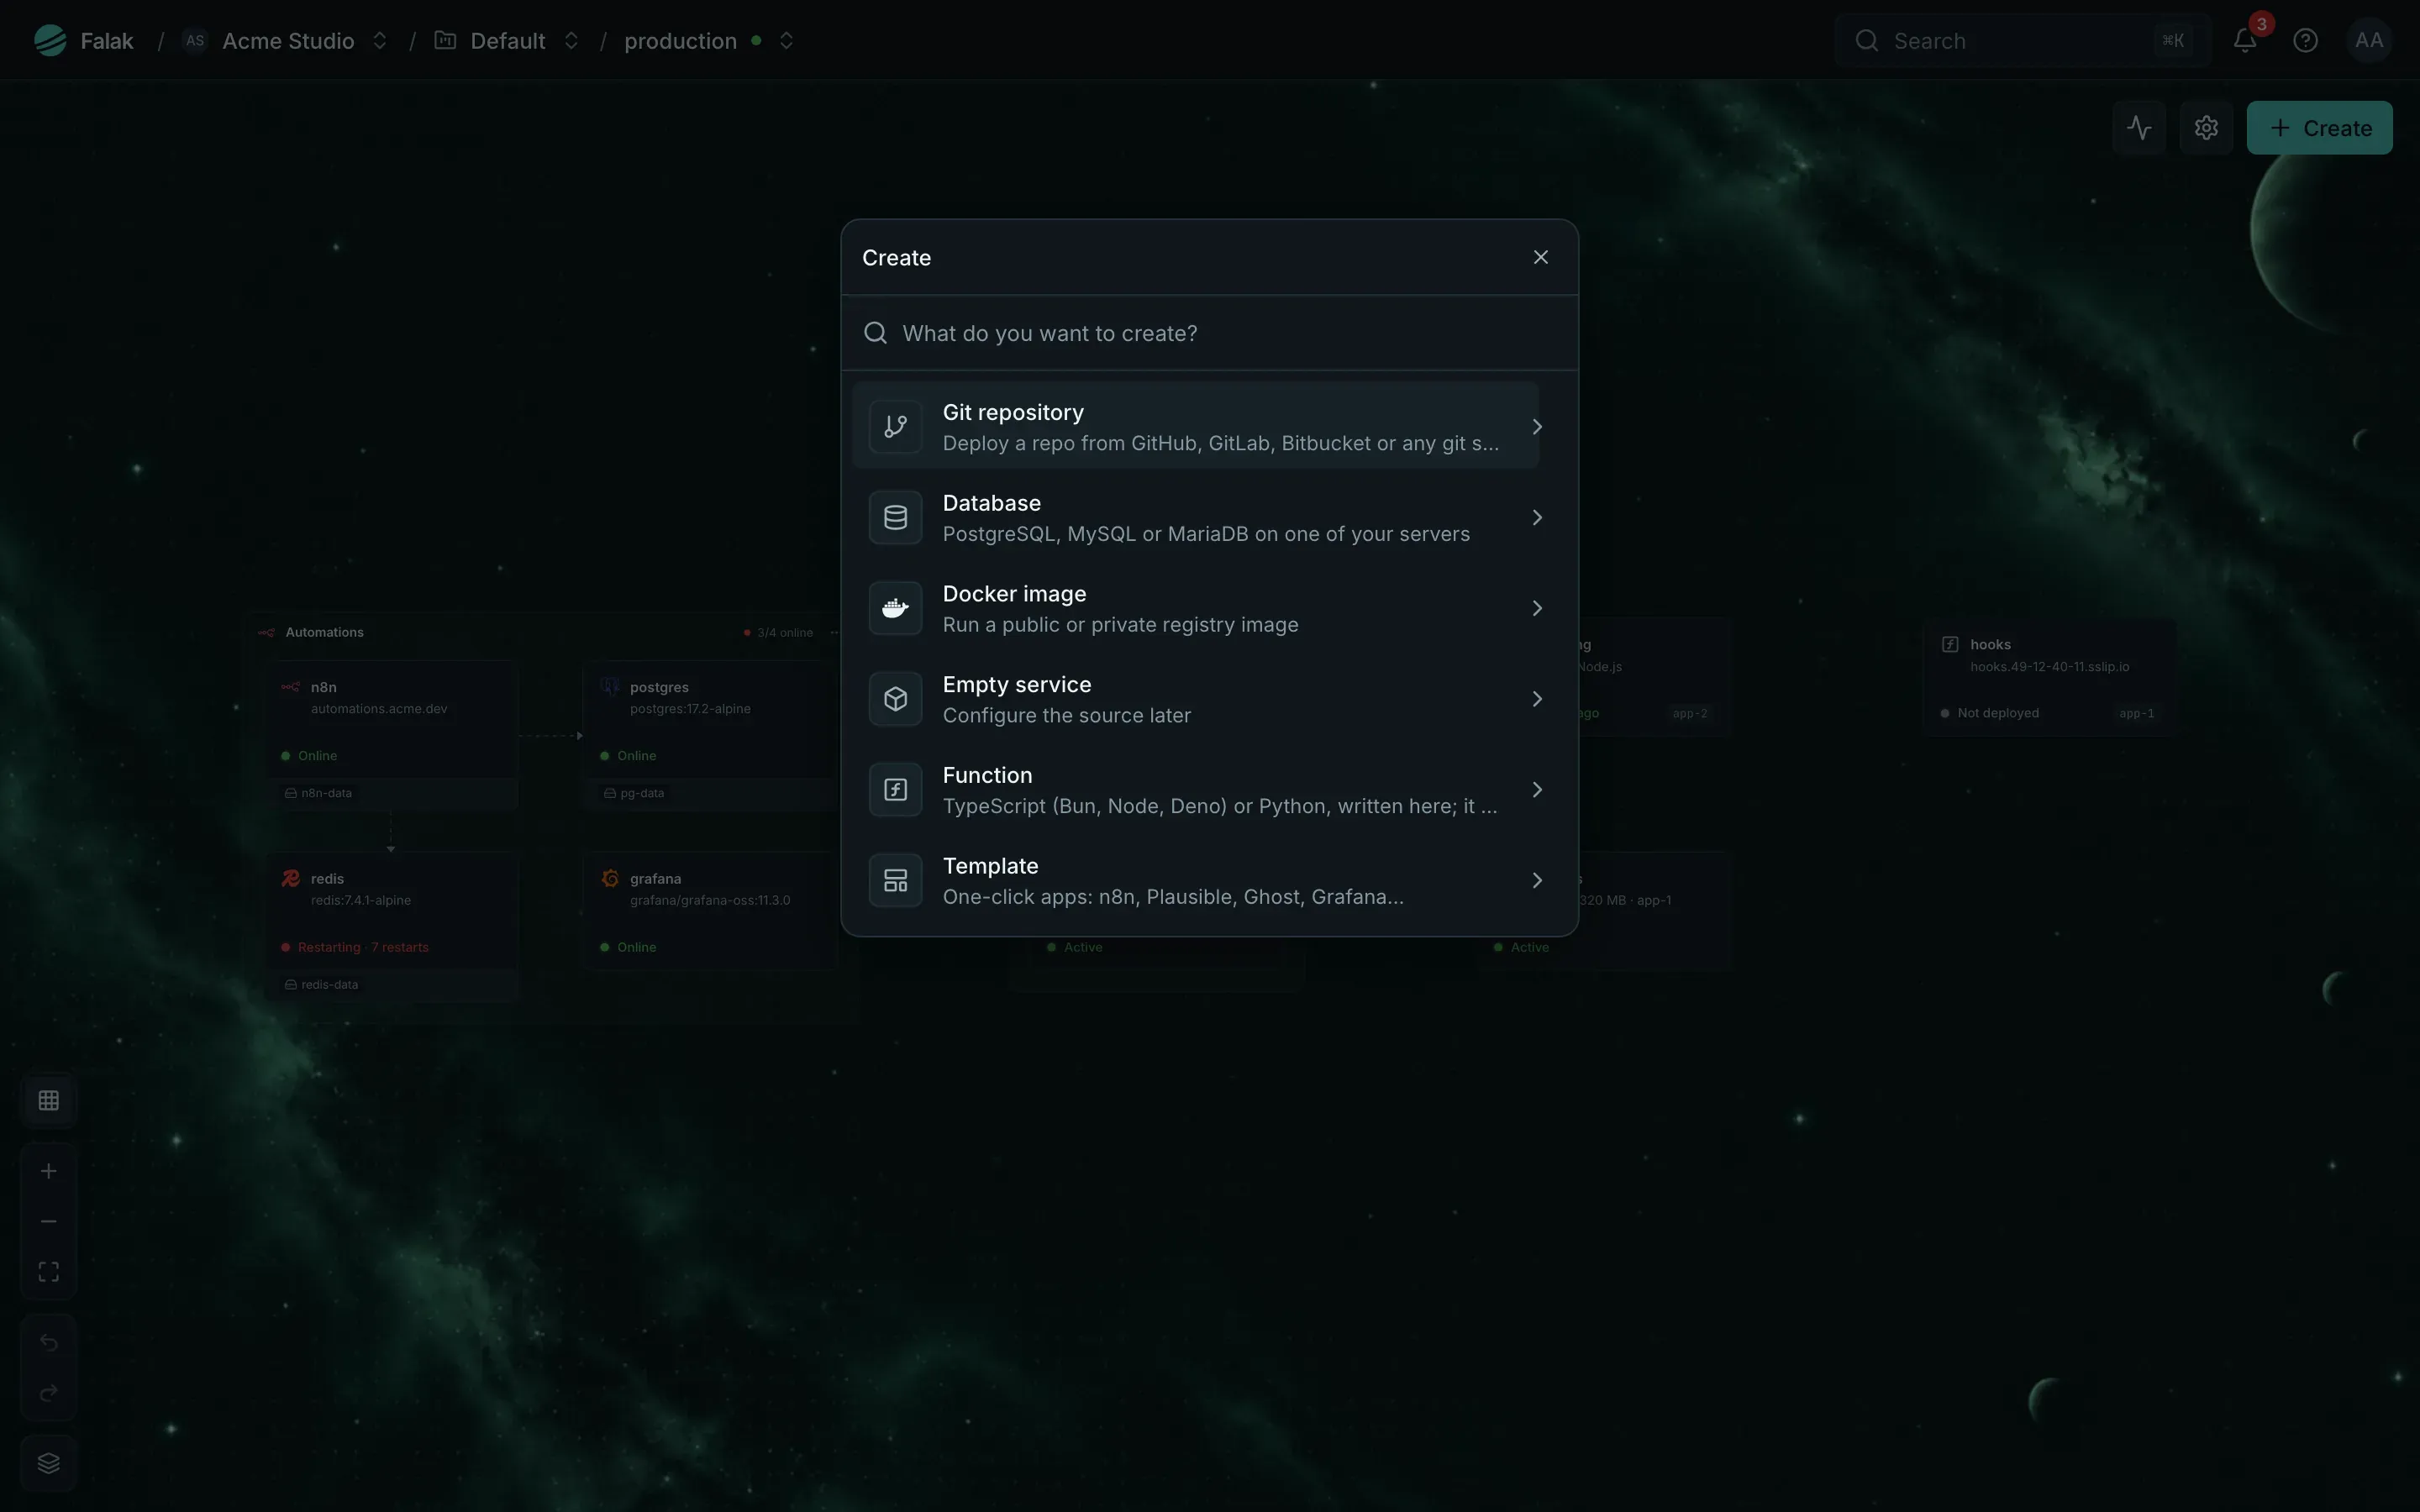
Typing narrows the list straight away, so creating a database is “Create, postg, Enter”:
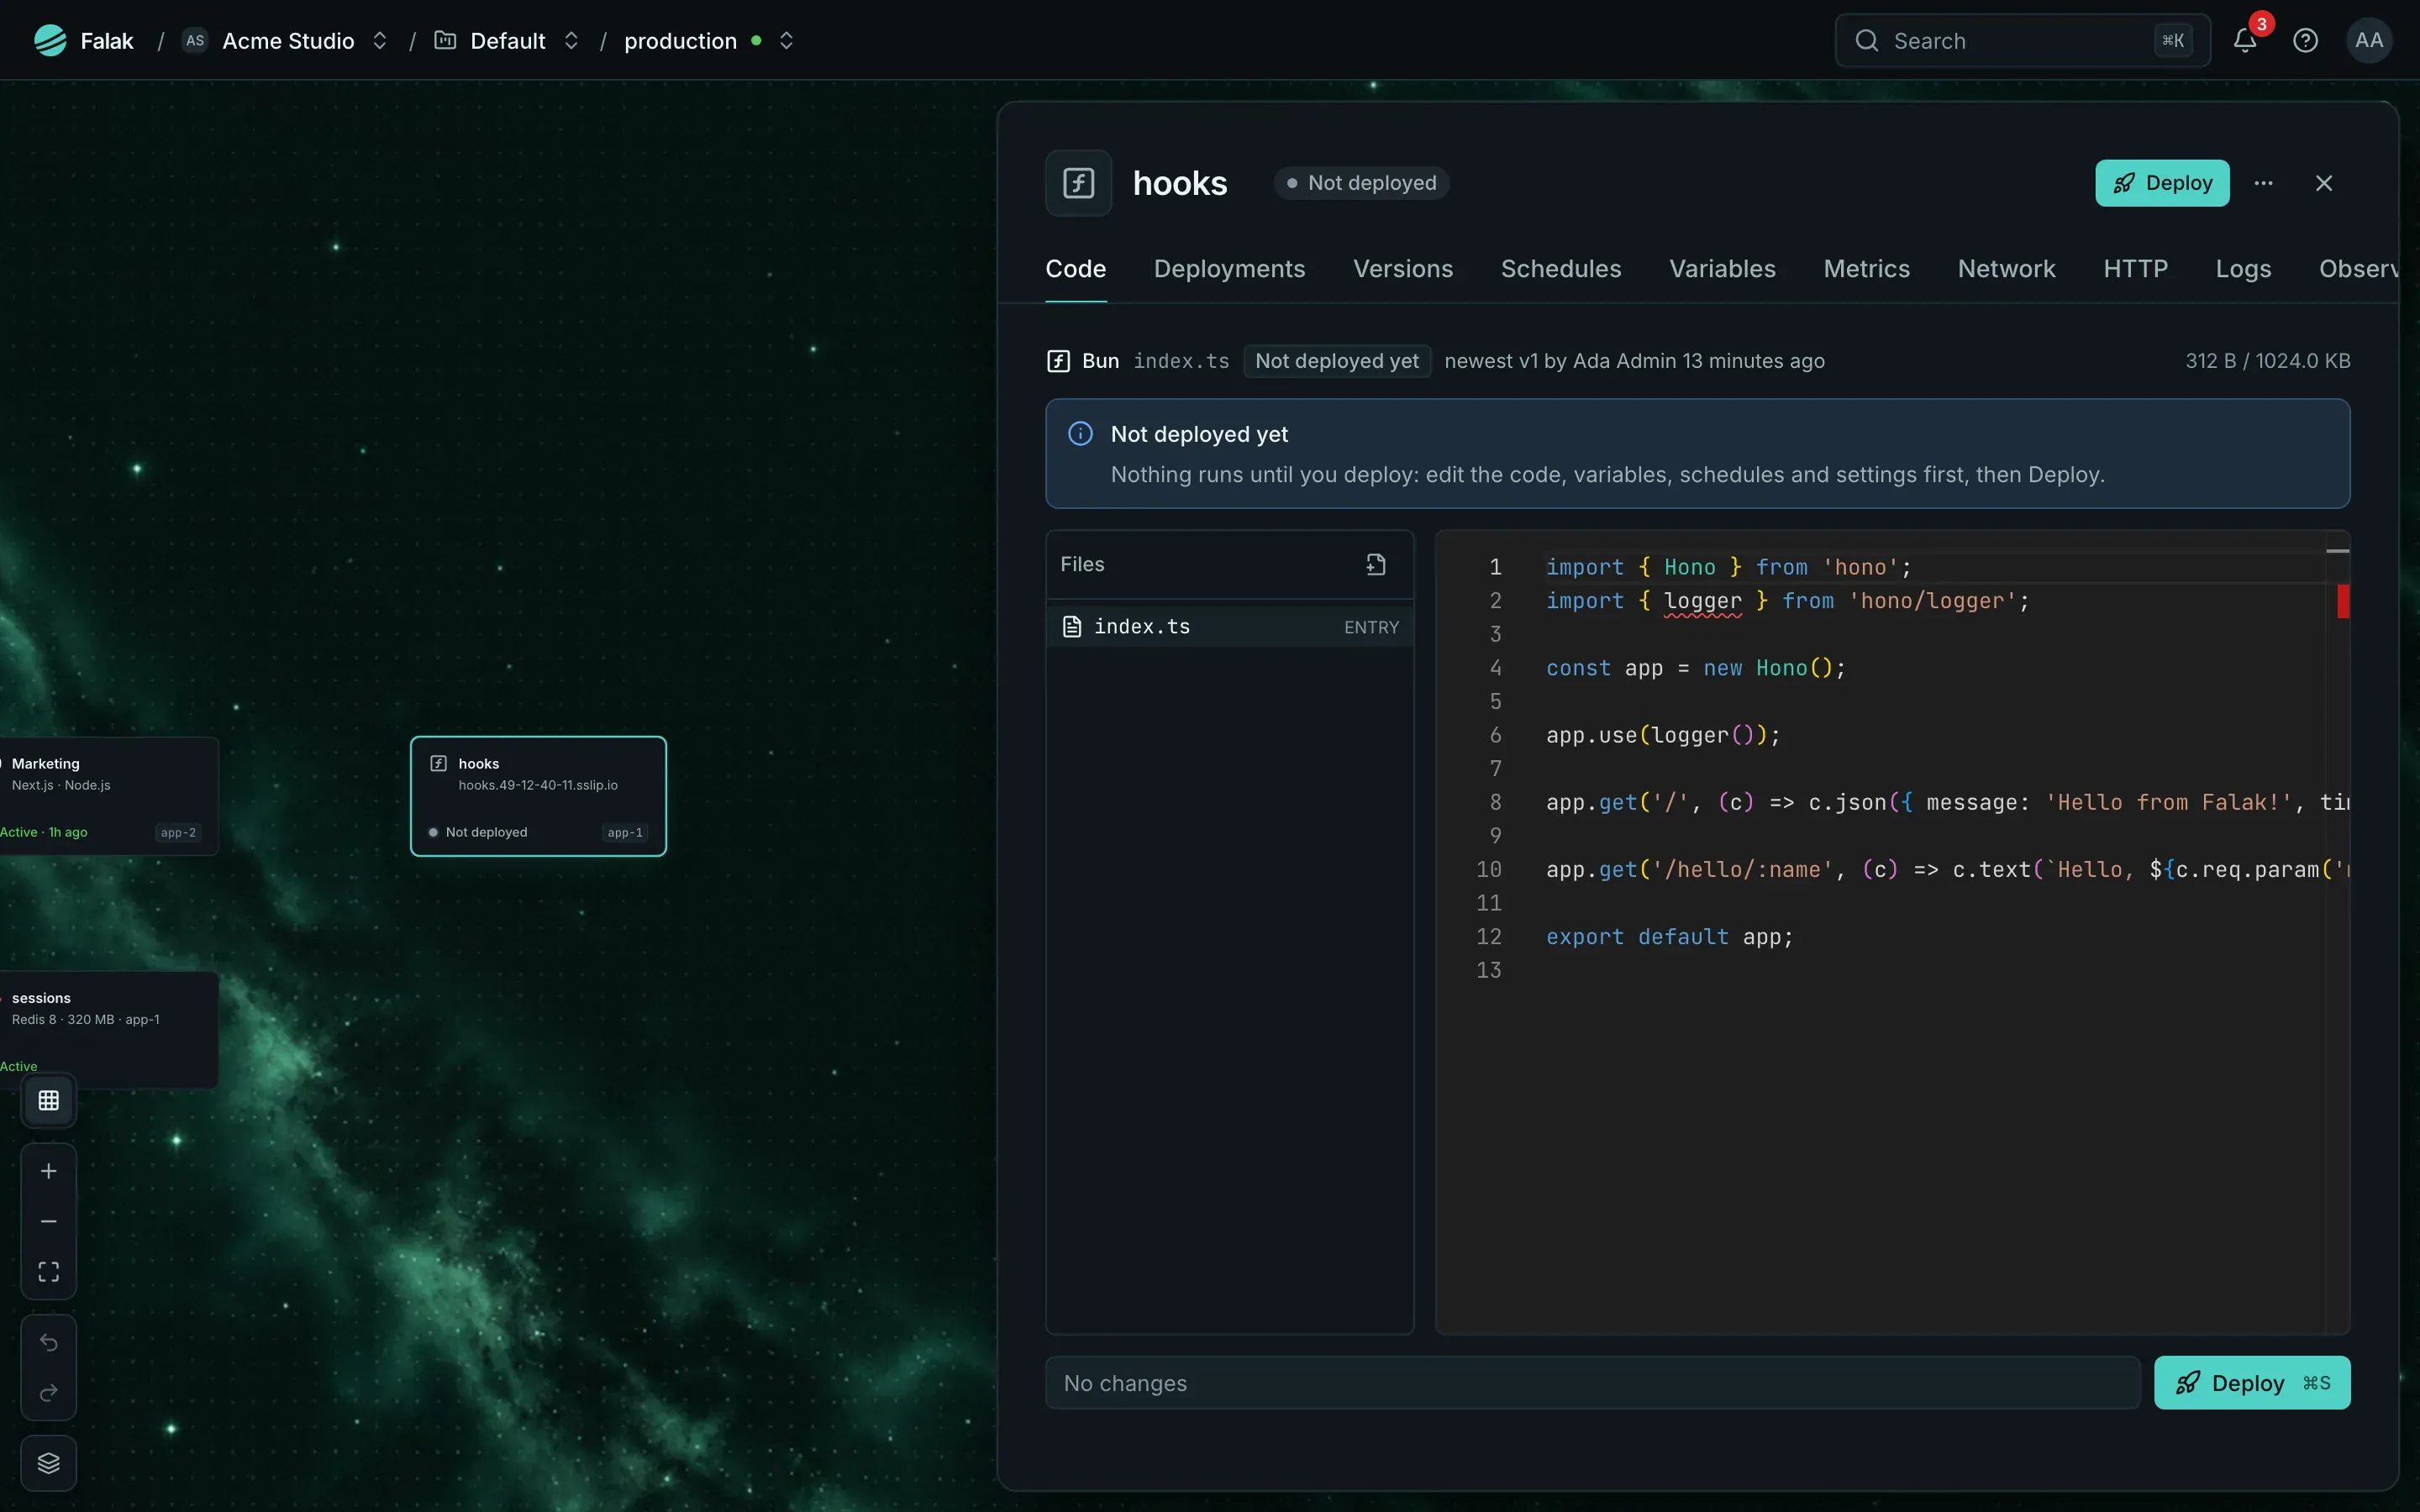
From there you pick a repository, an engine, a template or a function starter. A new function is created as a draft and opens on its Code tab, so you can edit it before anything runs:
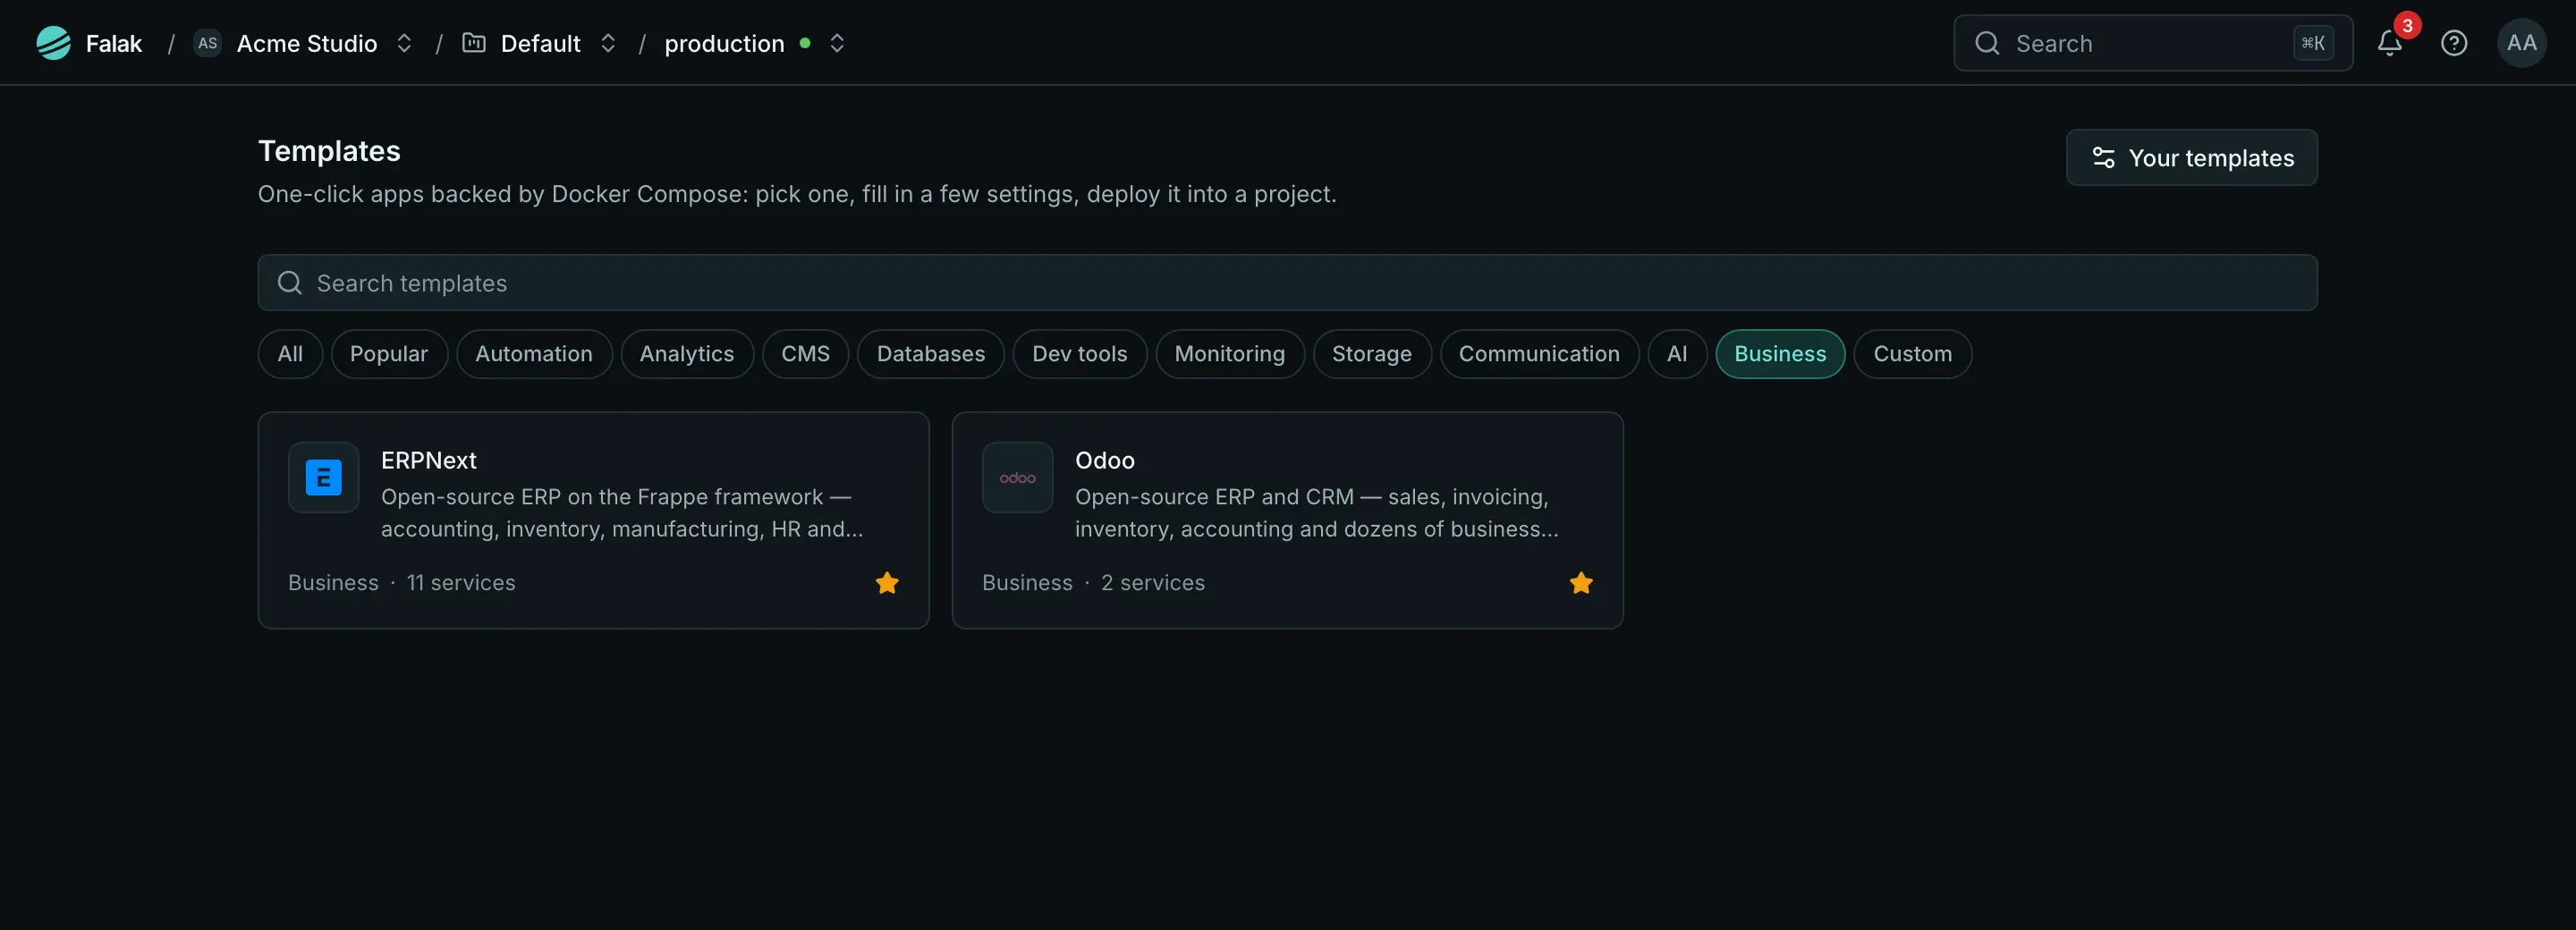
Templates are grouped by category. Since v0.19.0 the Business category has Odoo and ERPNext:
A service’s panel
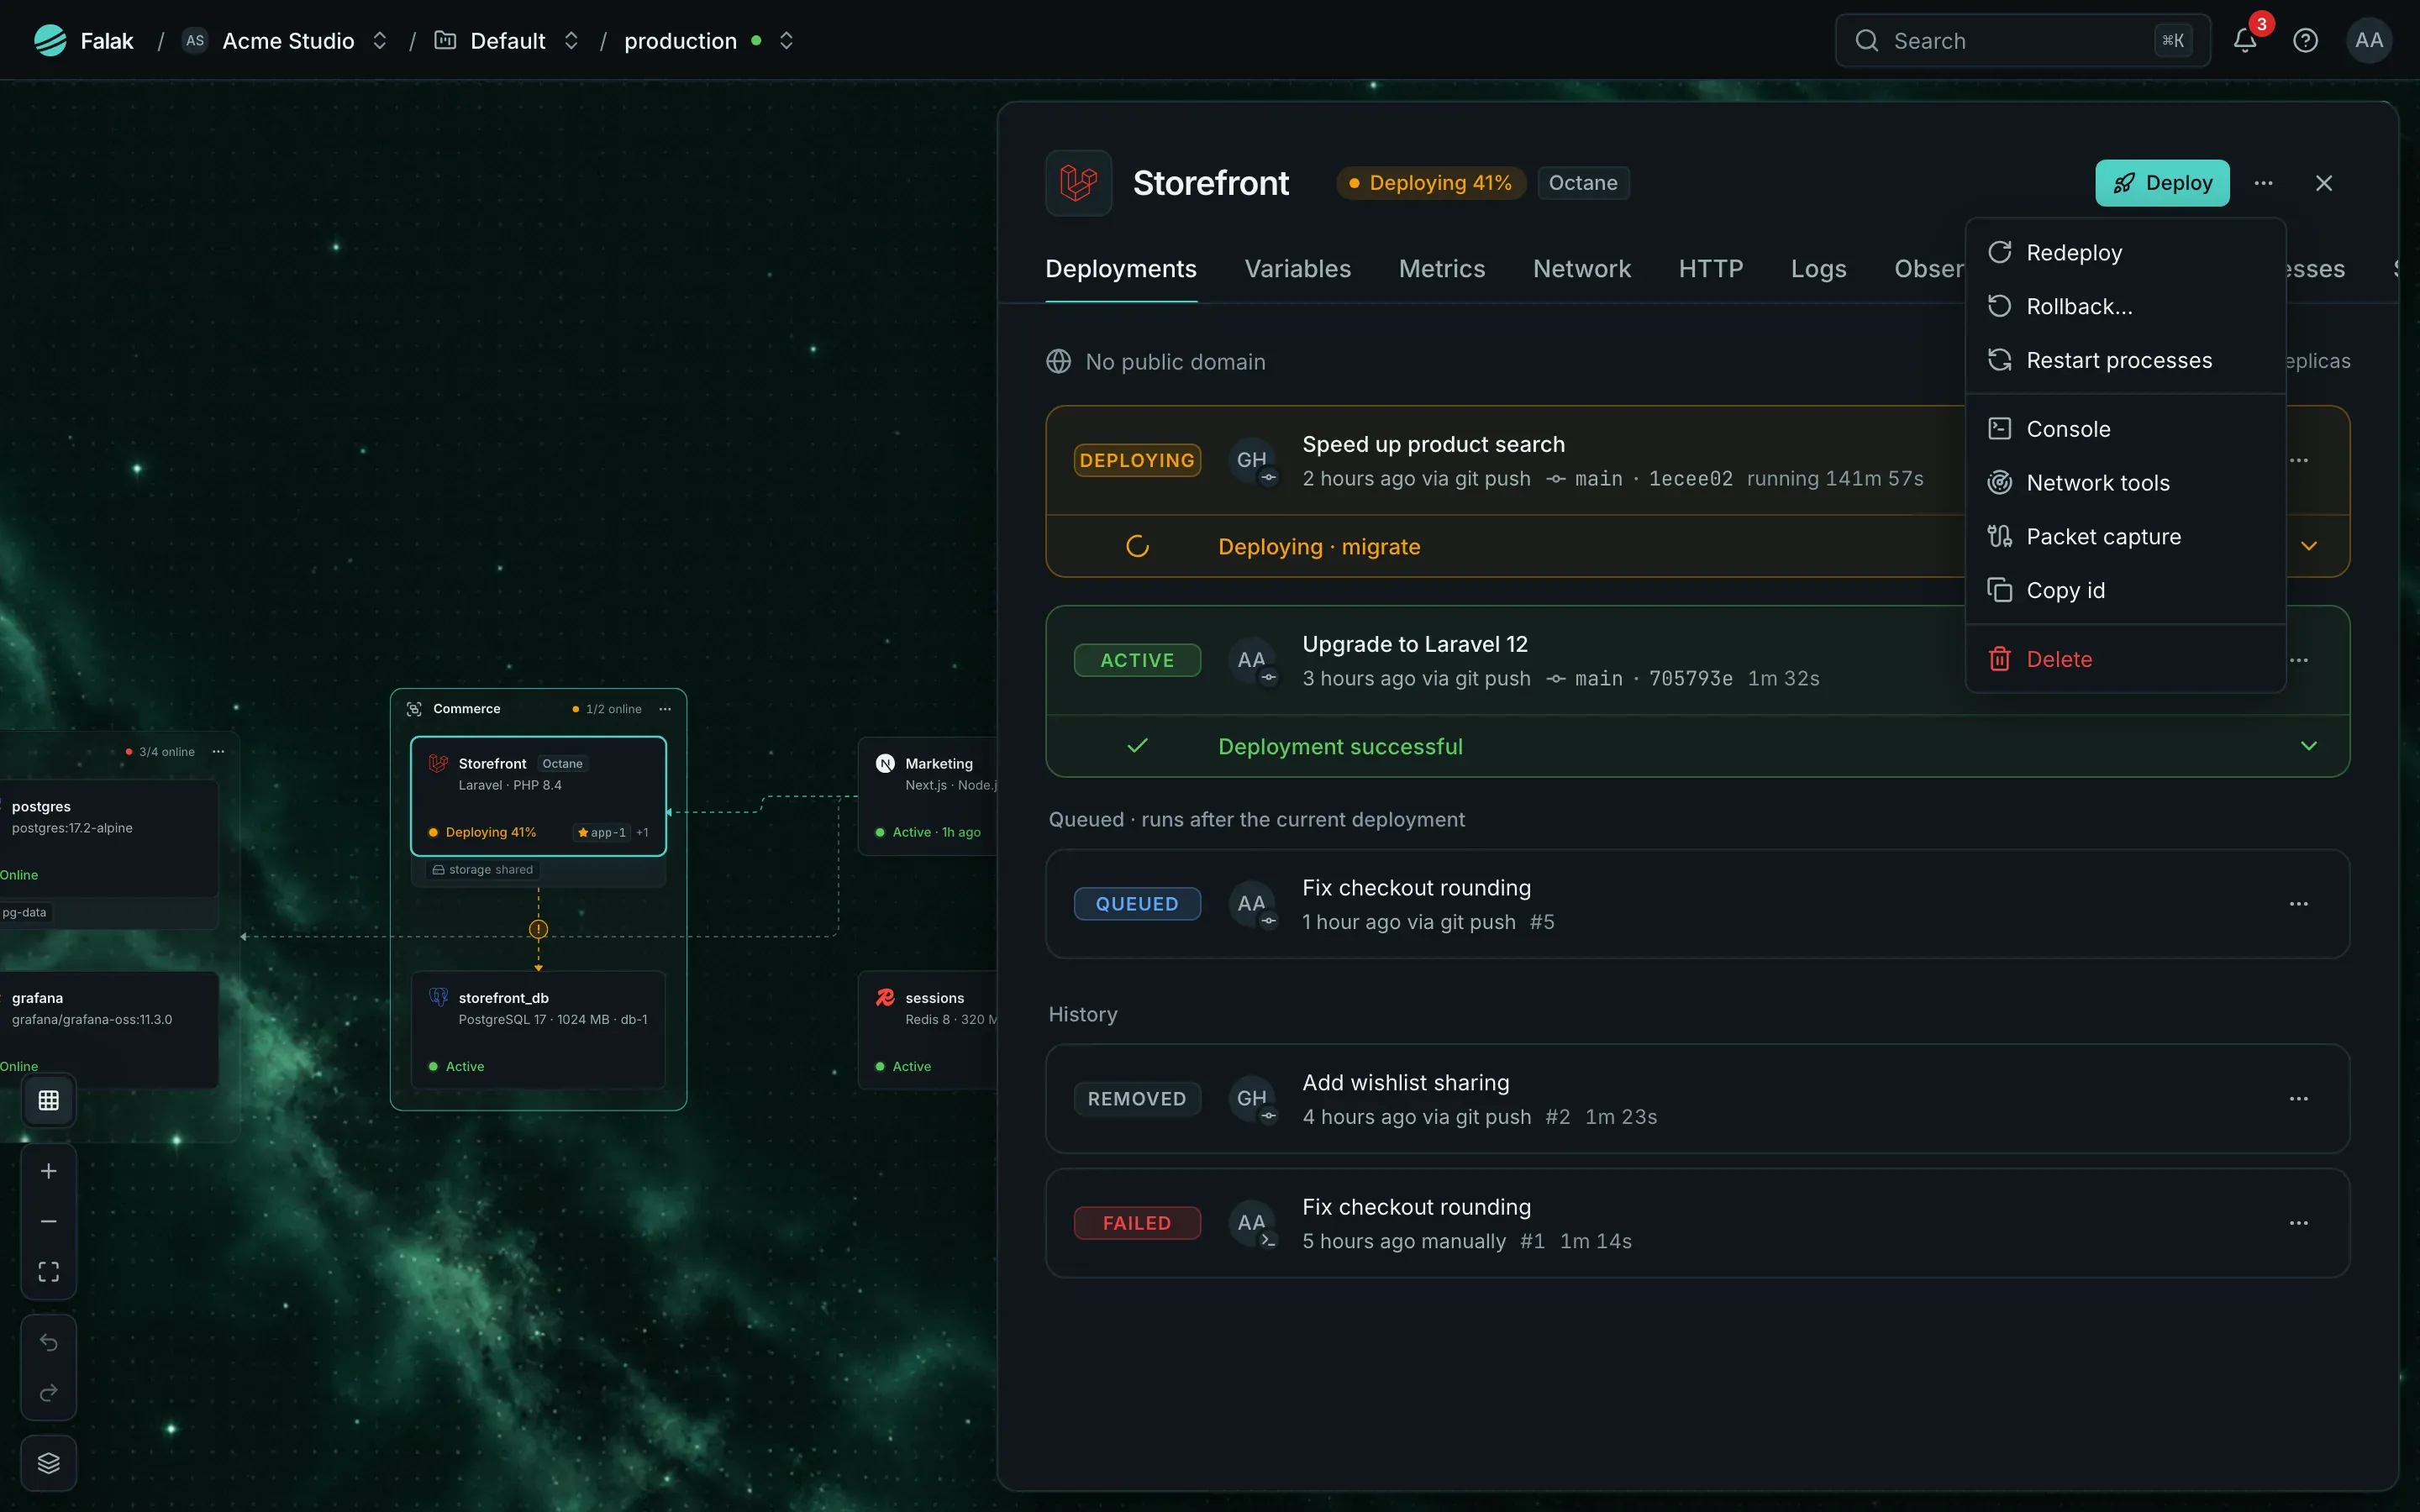
Section titled “A service’s panel”Click a card and its panel slides in over the canvas, which stays in view. A site’s tabs are Deployments, Variables, Metrics, Network, HTTP, Logs, Observability, Uptime, Processes and Settings. Deploy is at the top right.
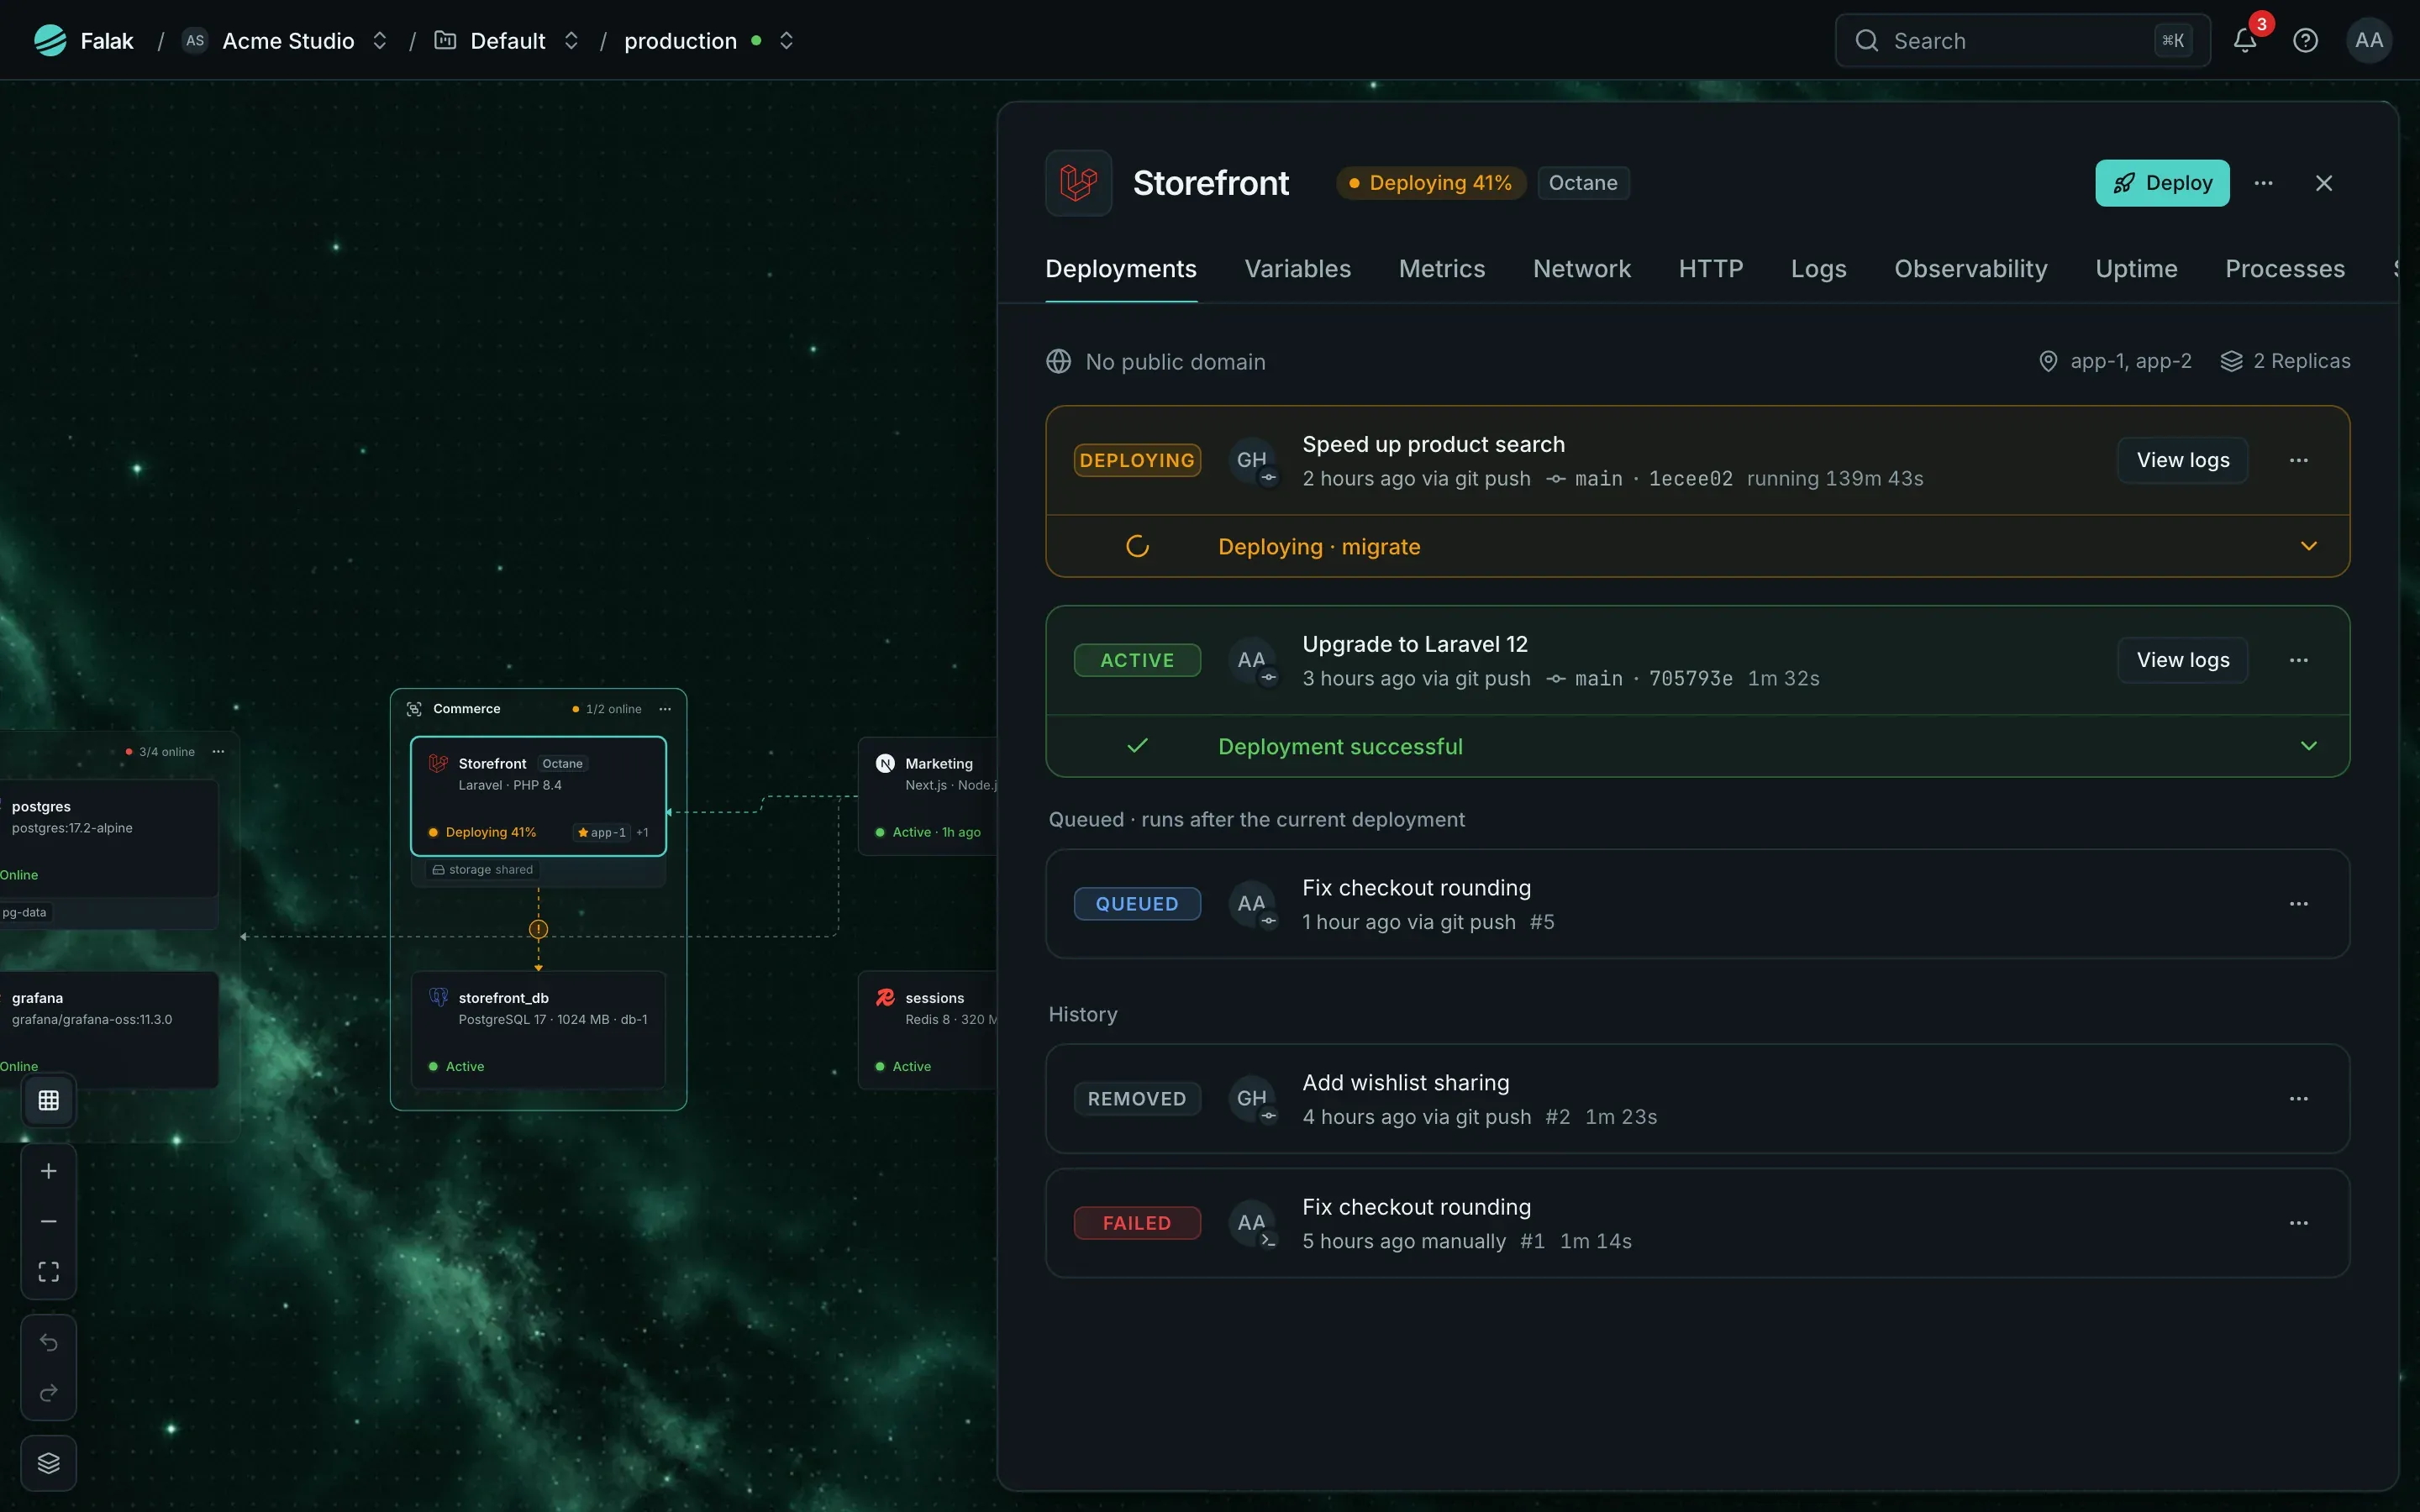
The ⋯ menu holds the less frequent actions: redeploy, roll back, restart processes, Console, Network tools, Packet capture, copy the id and delete.
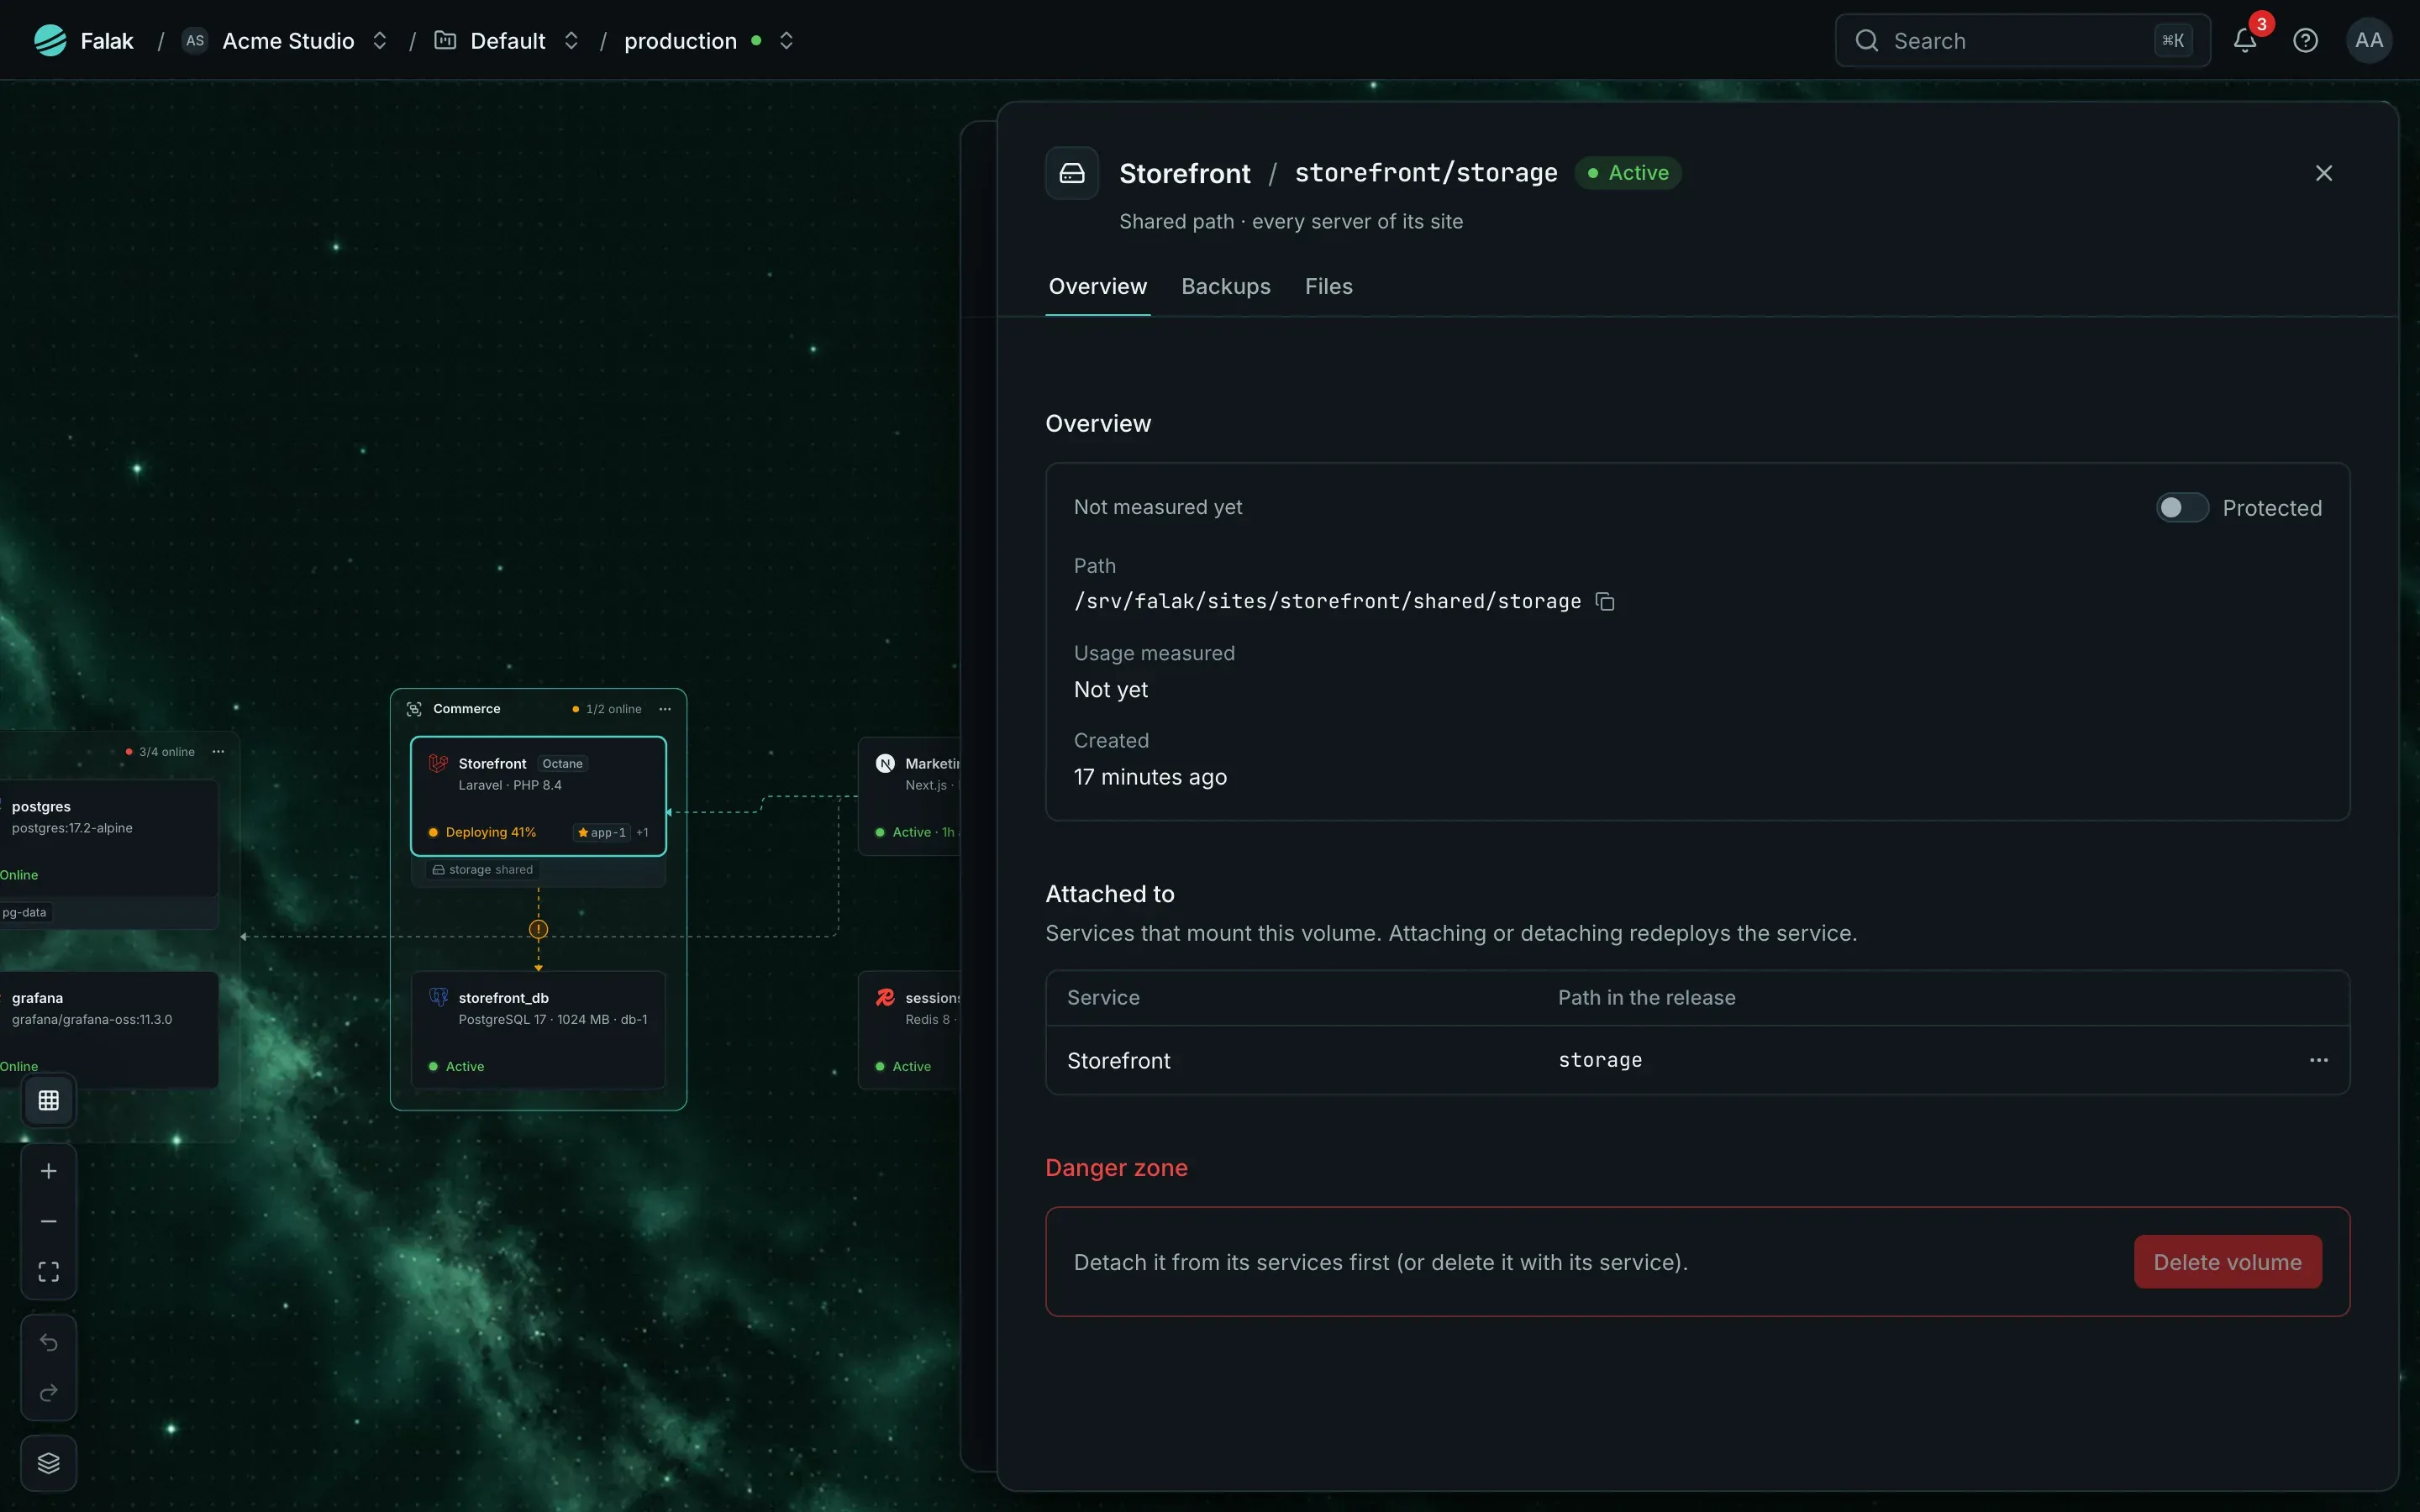
A volume chip on a card opens that volume over the panel, with its overview, backups and files:
Deploy and read the logs
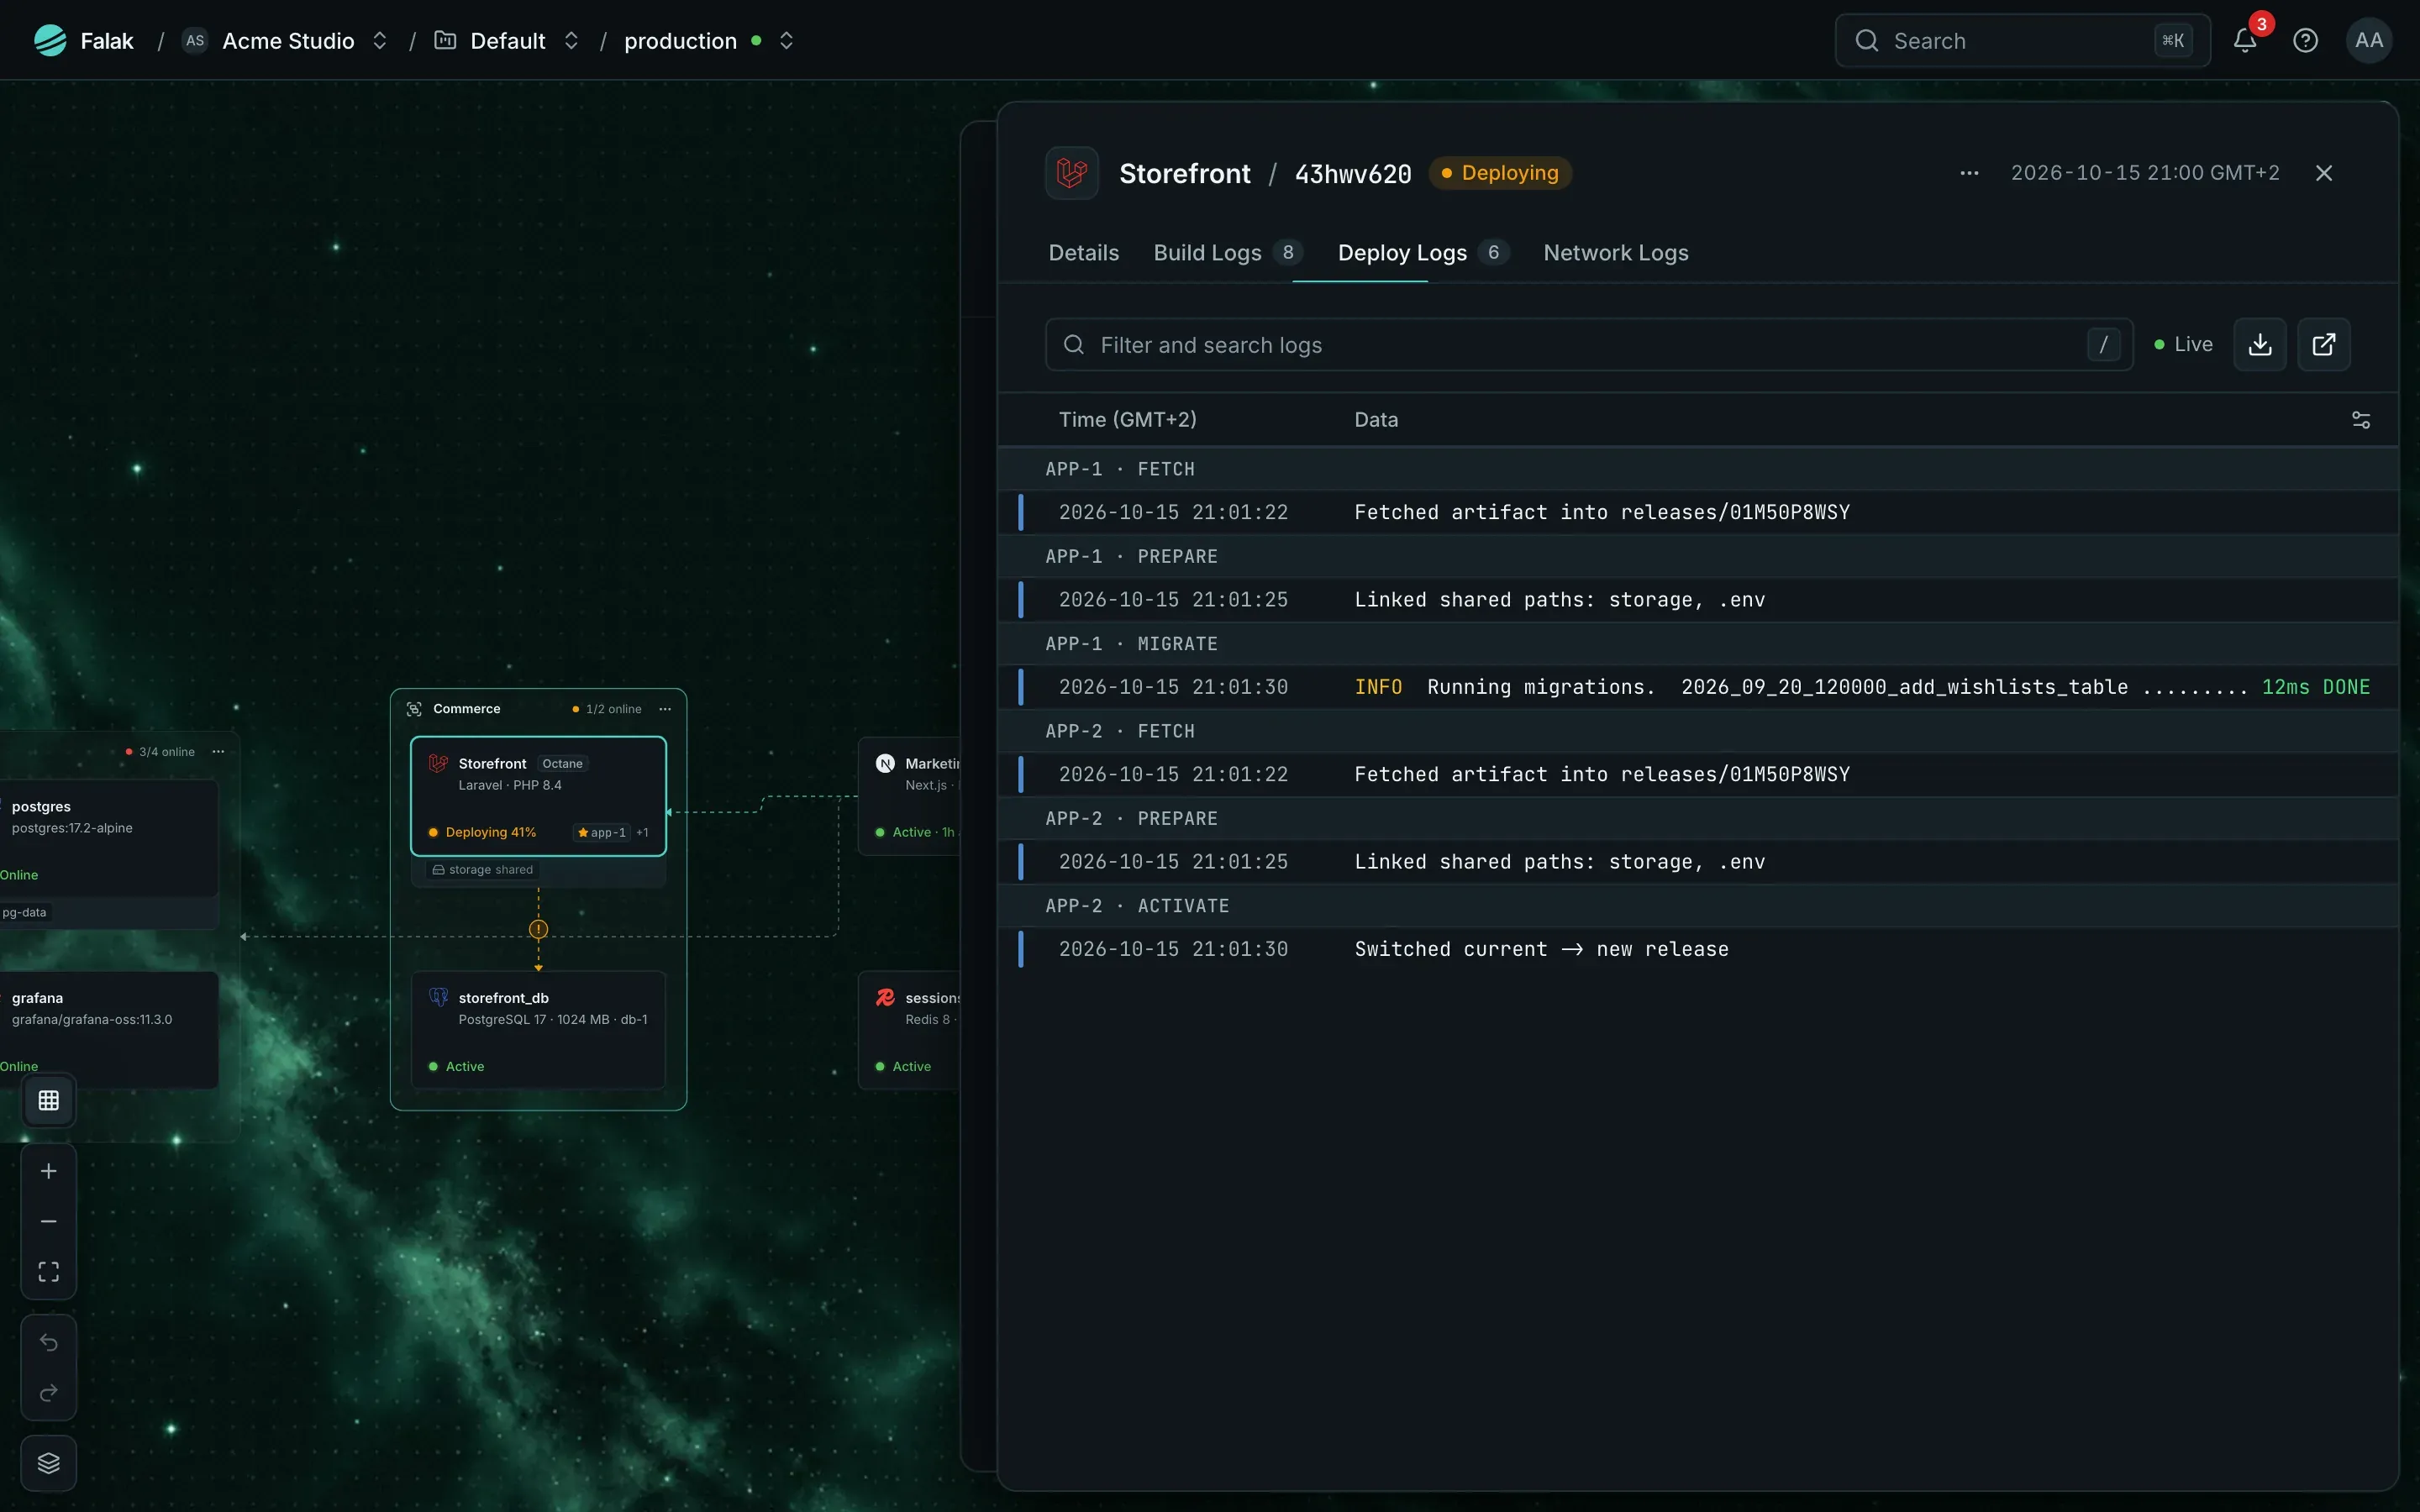
Section titled “Deploy and read the logs”View logs on a deployment opens it as a second panel, with its details, build logs, deploy logs per server and step (fetch, prepare, migrate, activate) and the network logs of its release.
The Logs, Metrics, HTTP and Network tabs show the site’s own logs, resource usage, traffic and connections once the observability stack is enabled. See Logs, Metrics, HTTP traffic and Network connections.
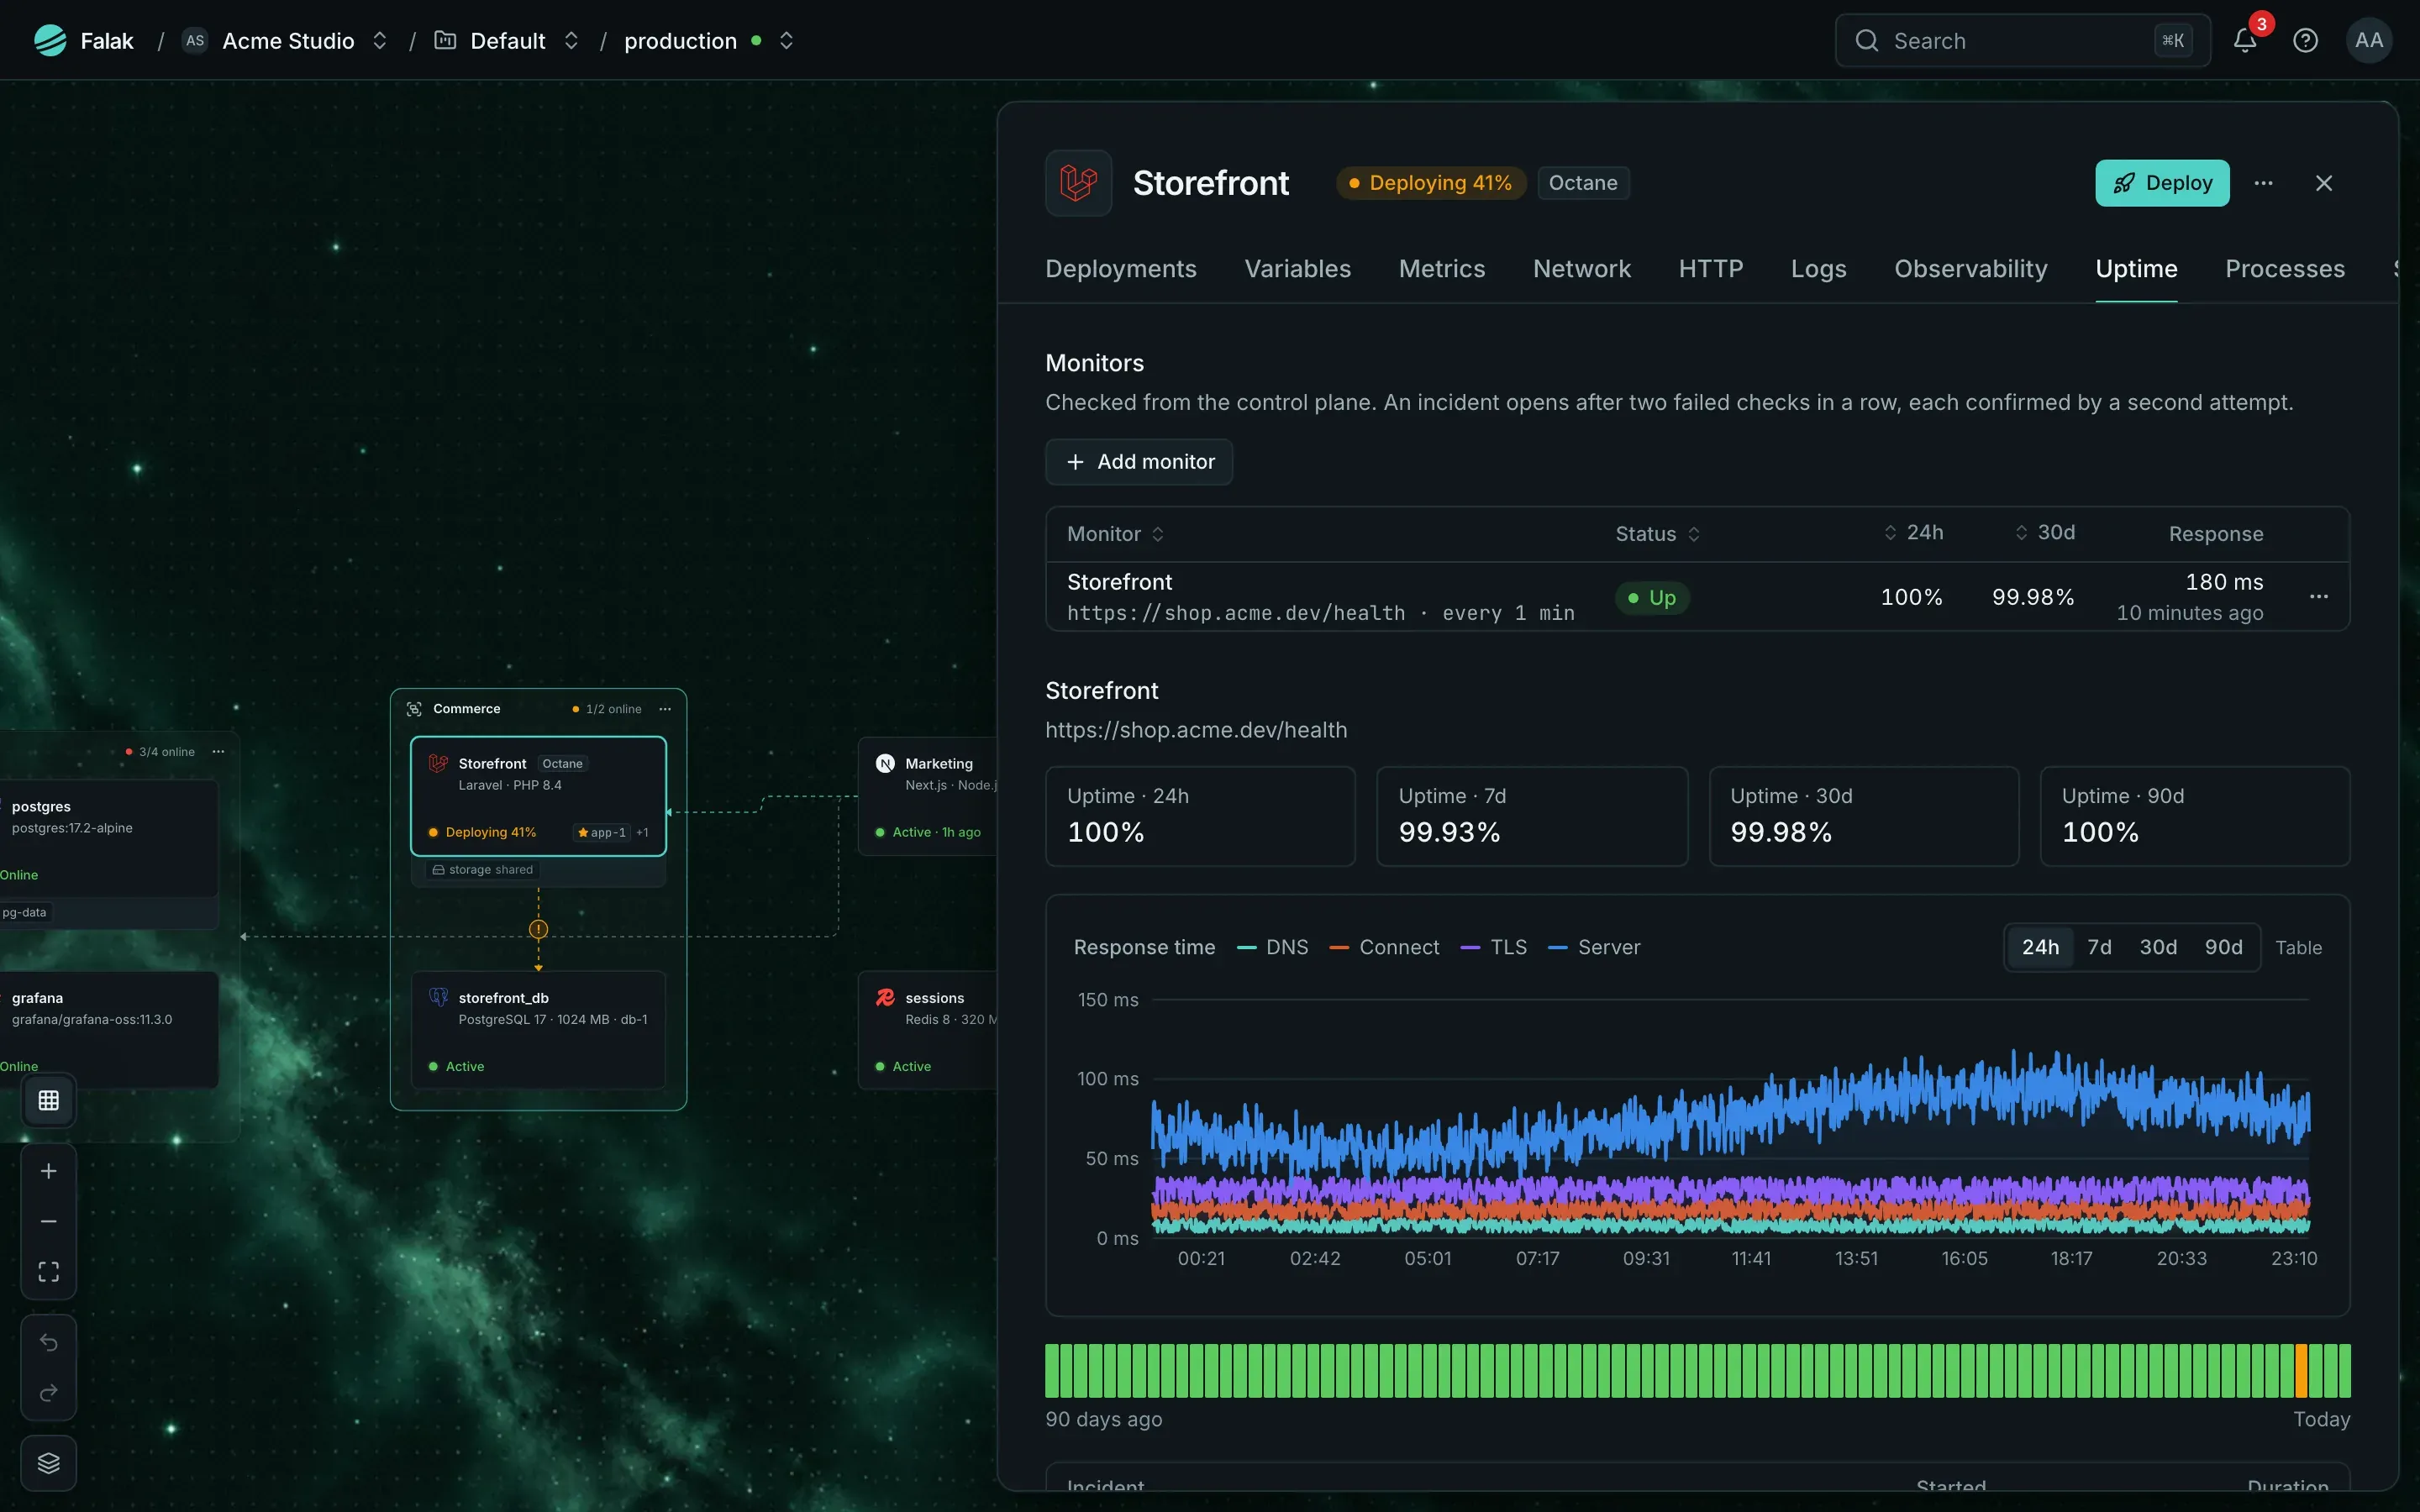
The Uptime tab shows the site’s monitors, their uptime over 24 hours to 90 days and the response time split into DNS, connect, TLS and server time:
Databases
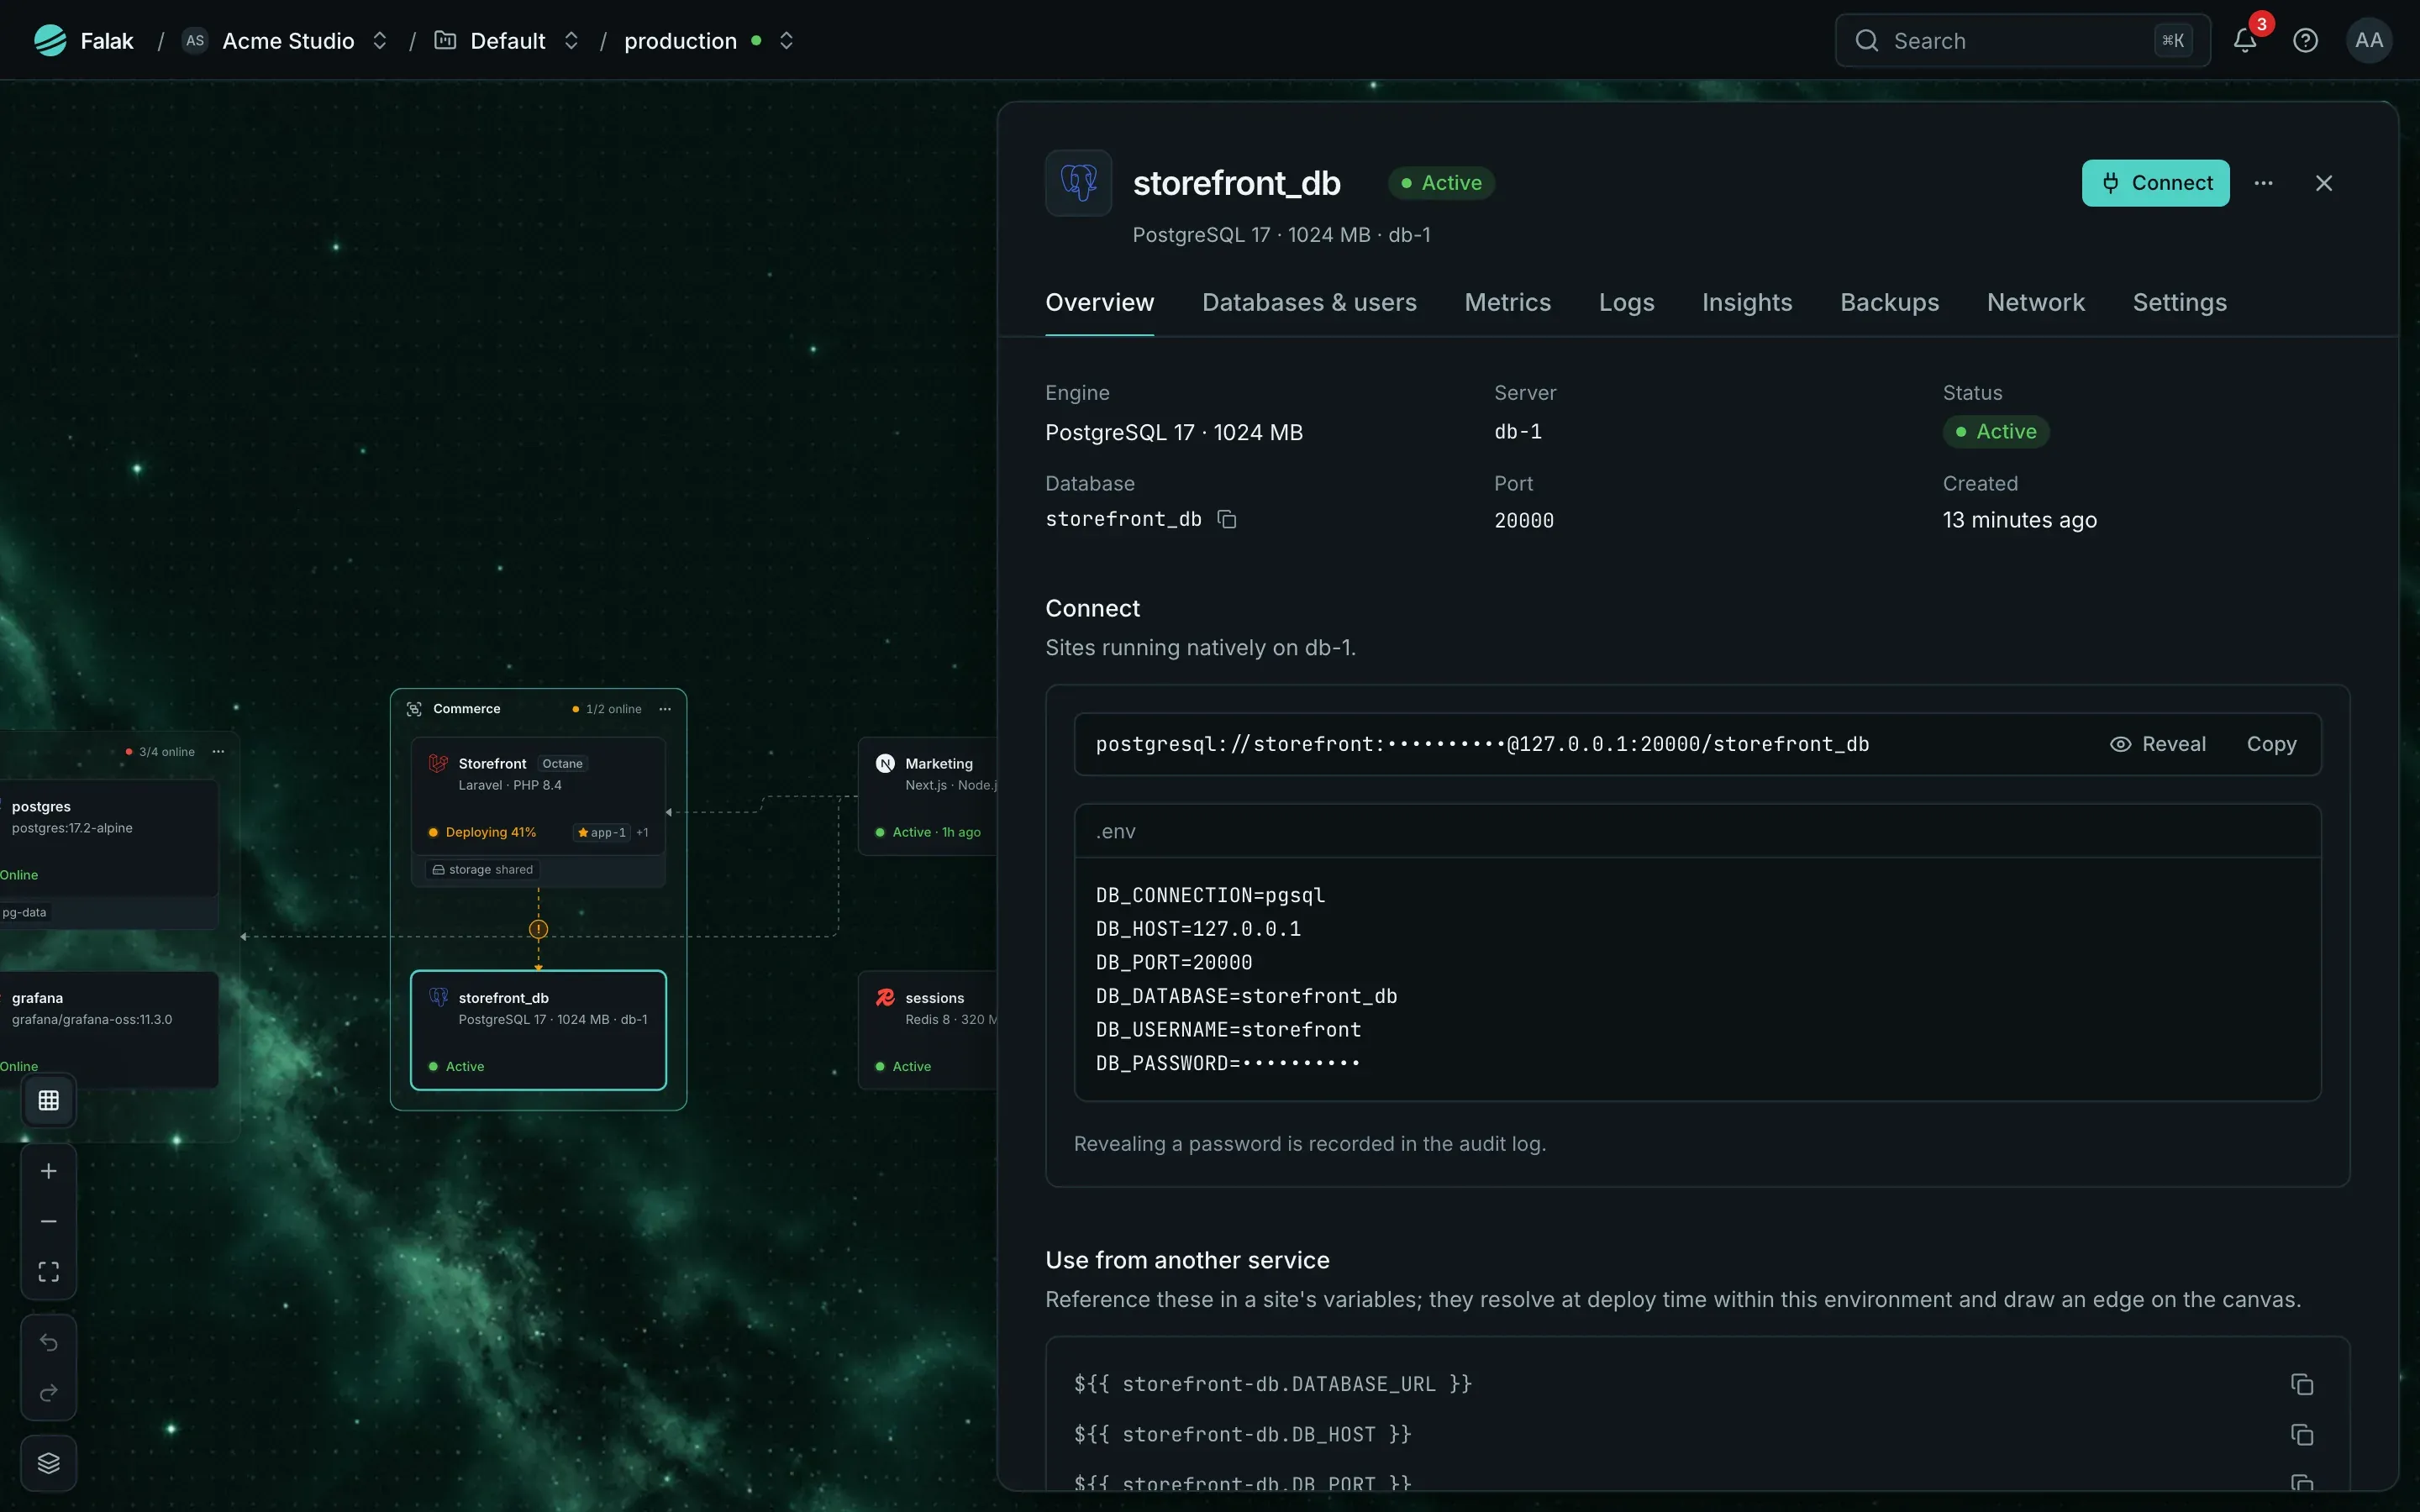
Section titled “Databases”A database’s panel has Overview (connection details and the references other services use), Databases & users, Metrics, Logs, Insights, Backups, Network and Settings.
Insights turns what the engine reports into recommendations, Issues and top queries:
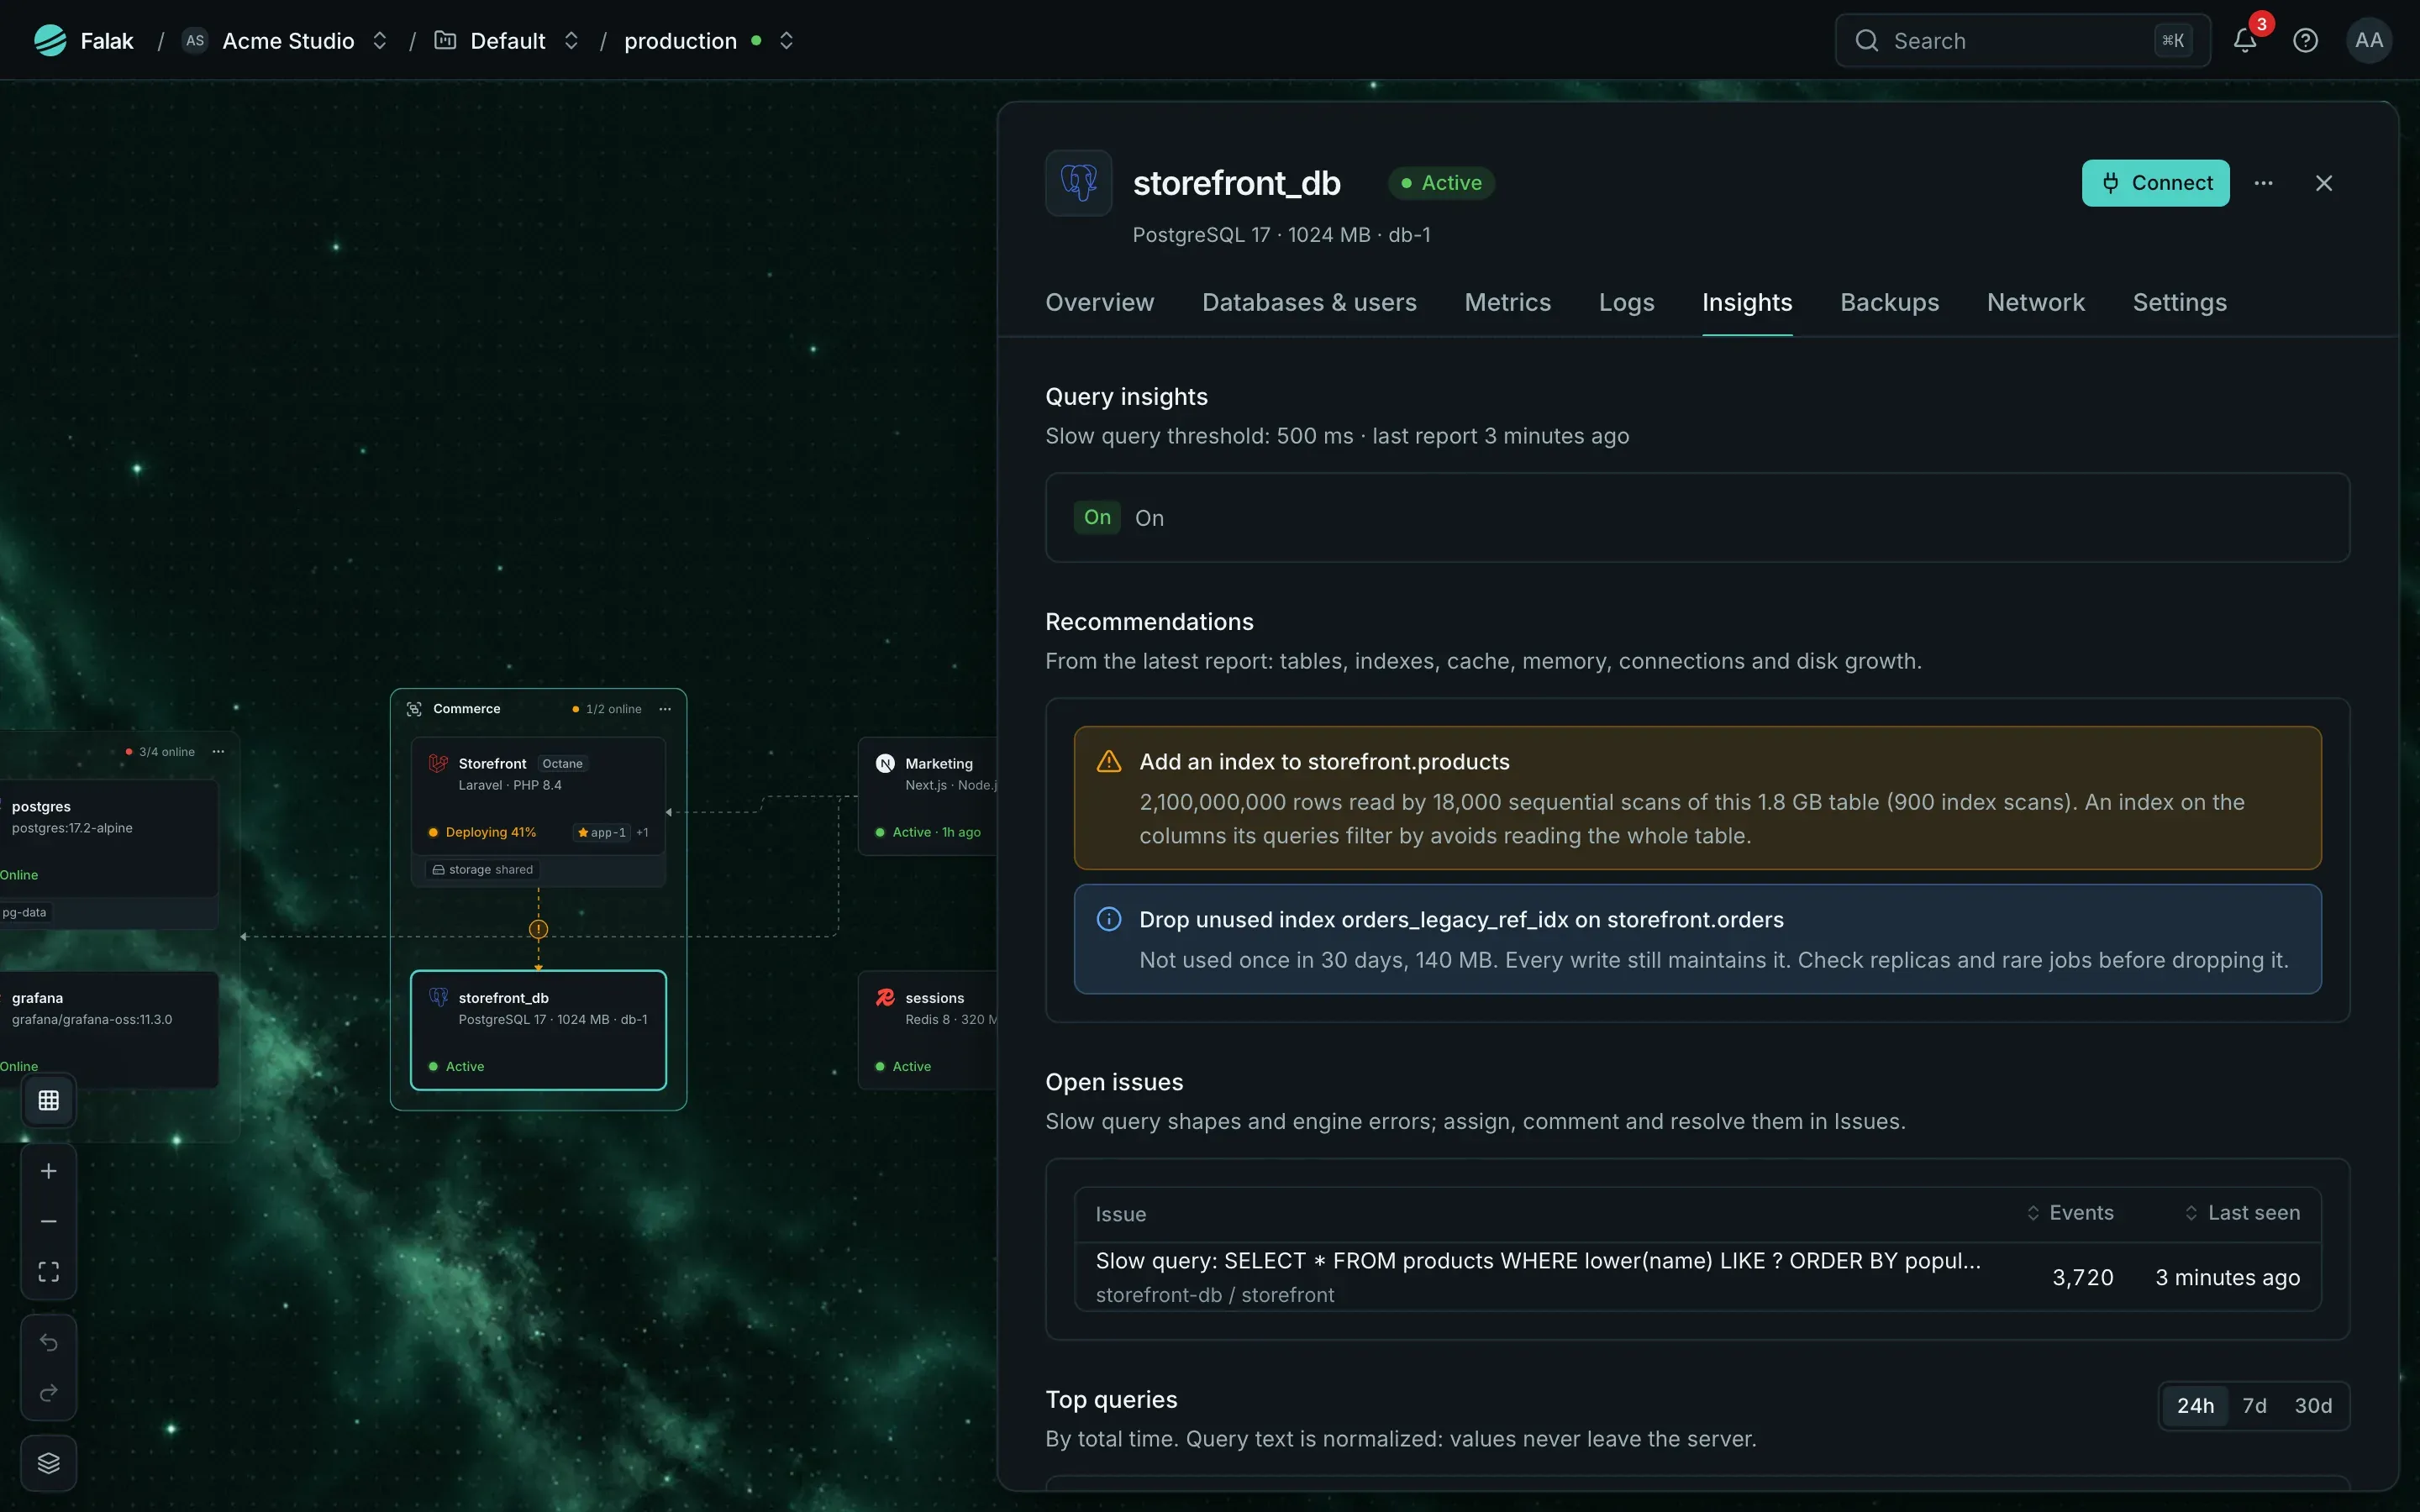
See Database metrics, logs and insights.
Servers
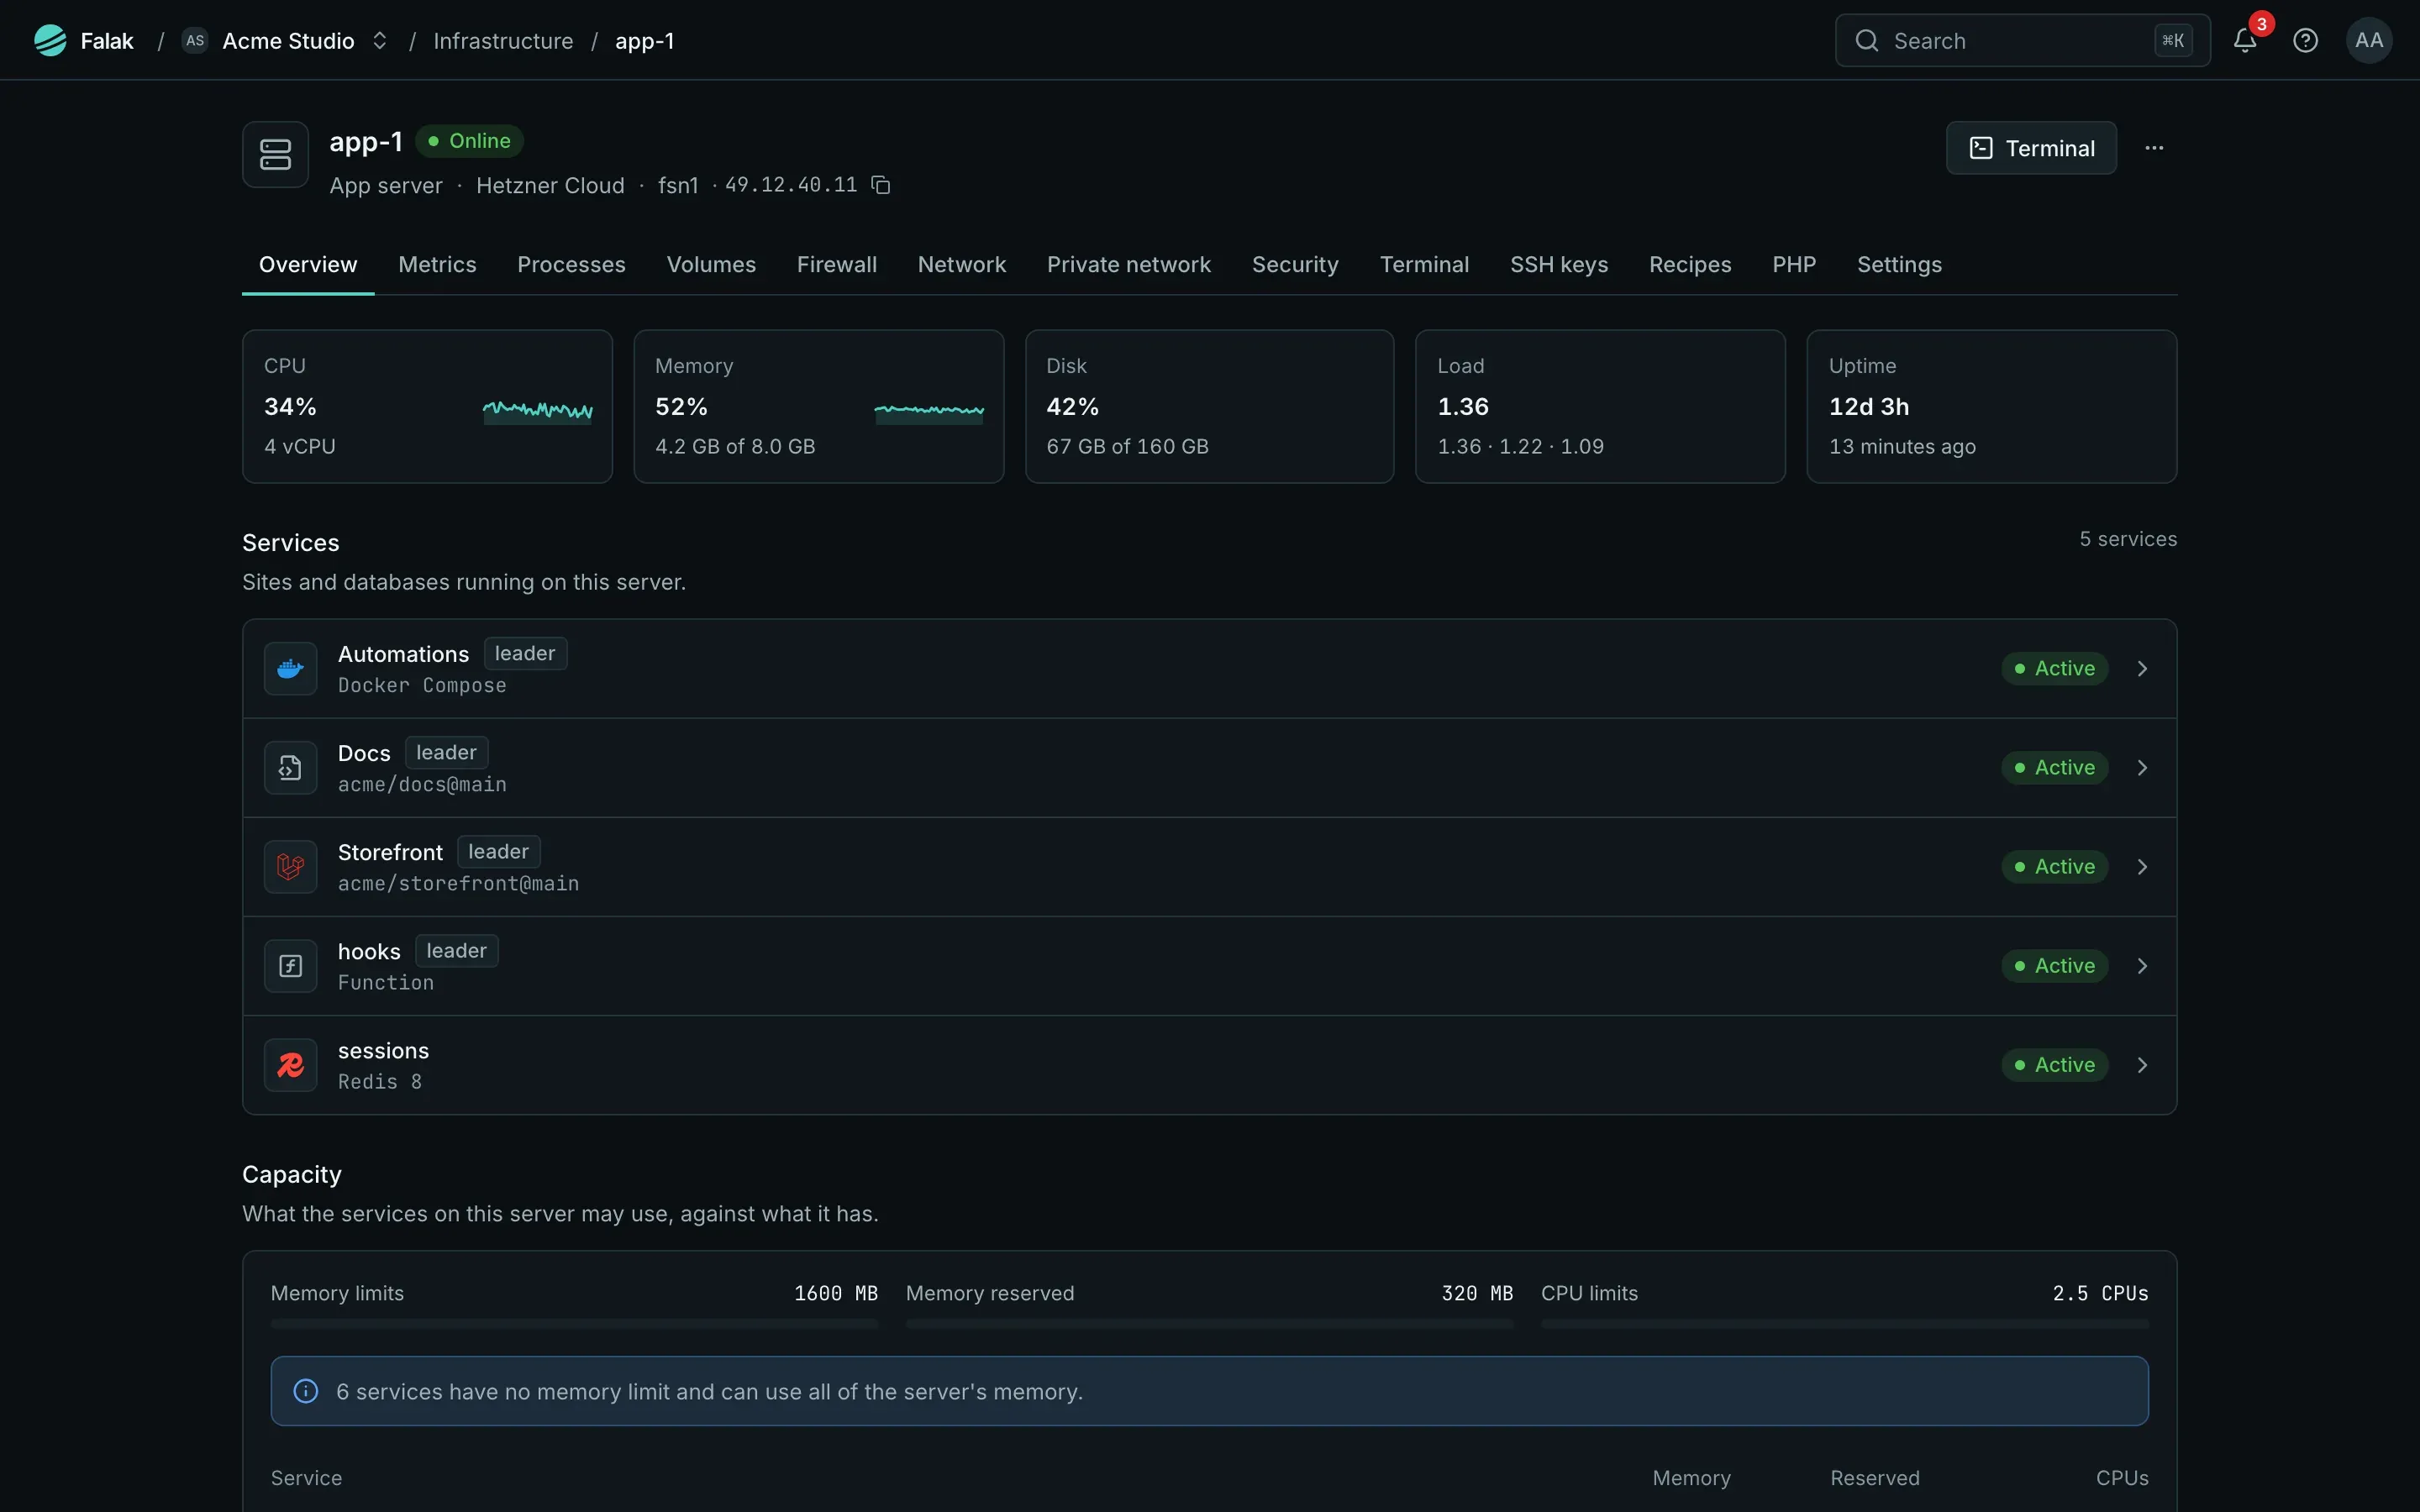
Section titled “Servers”Infrastructure → Servers lists every server. A server’s page has Overview (usage, the services it runs, capacity, agent and machine check), Metrics, Processes, Volumes, Firewall, Network, Private network, Security, Terminal, SSH keys, Recipes, PHP and Settings.
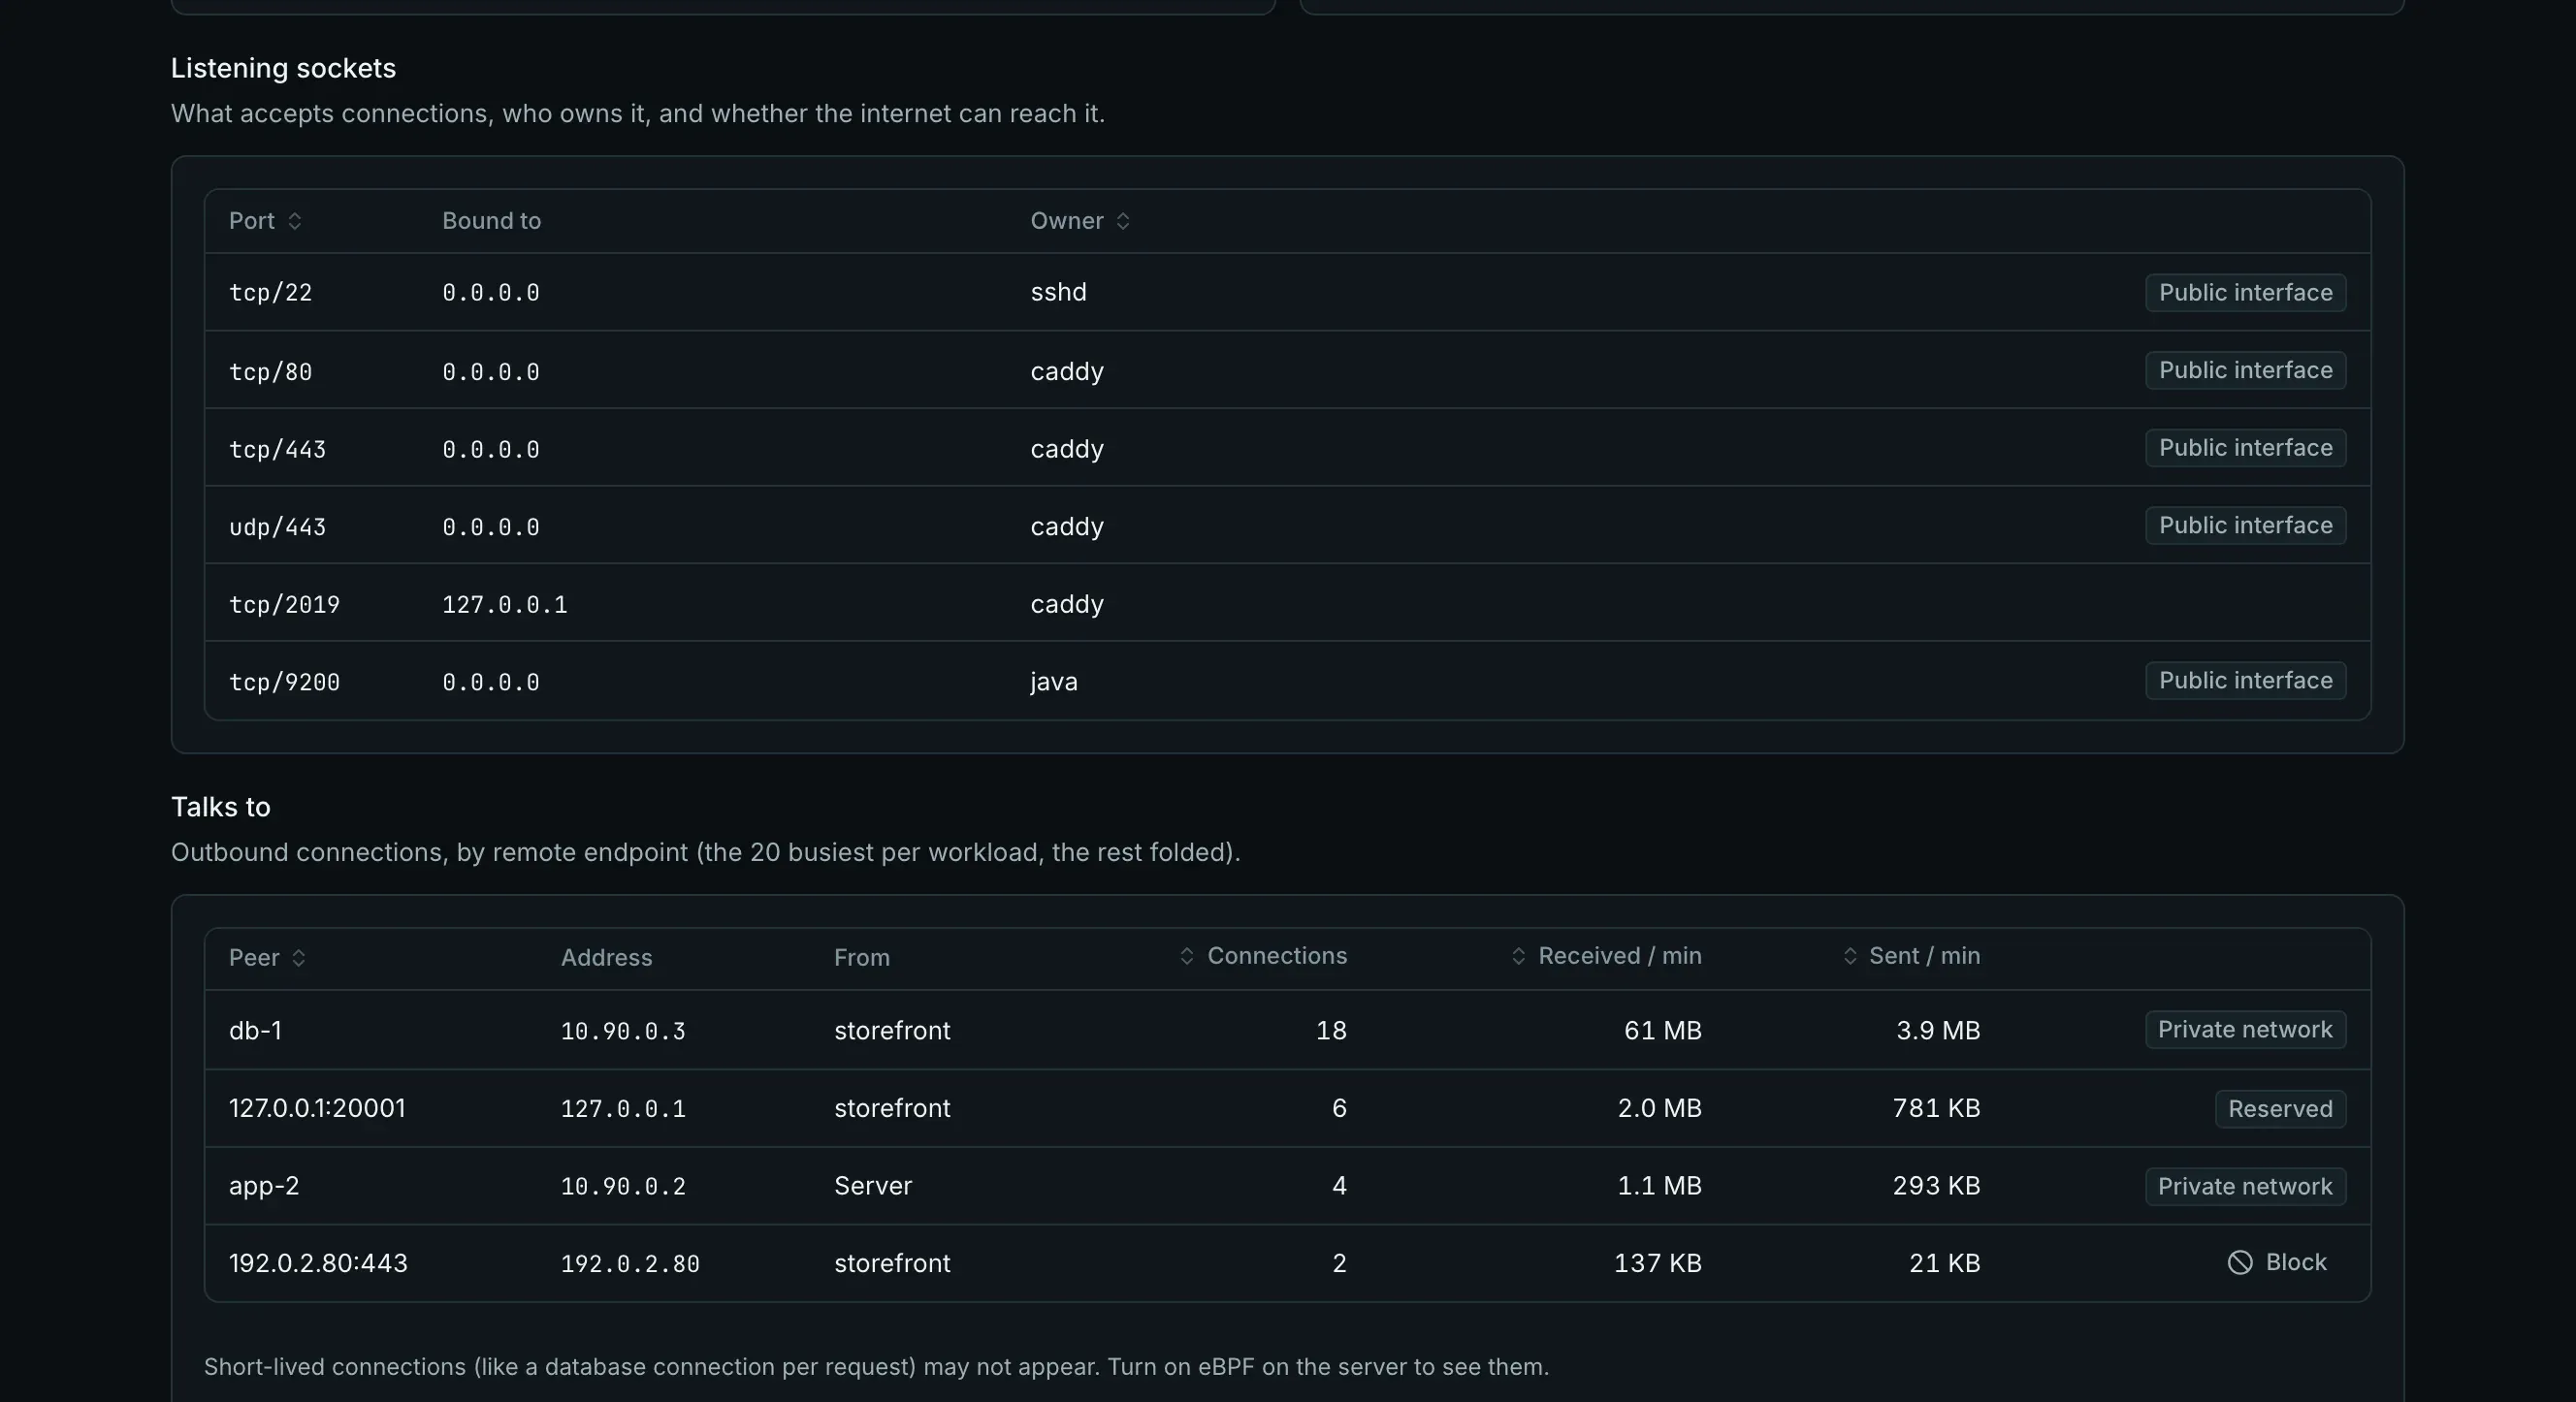
The Network tab shows its listening sockets, whom its workloads talk to, its clients and WireGuard peers, then the eBPF switch, the network tools and packet capture:
Observability
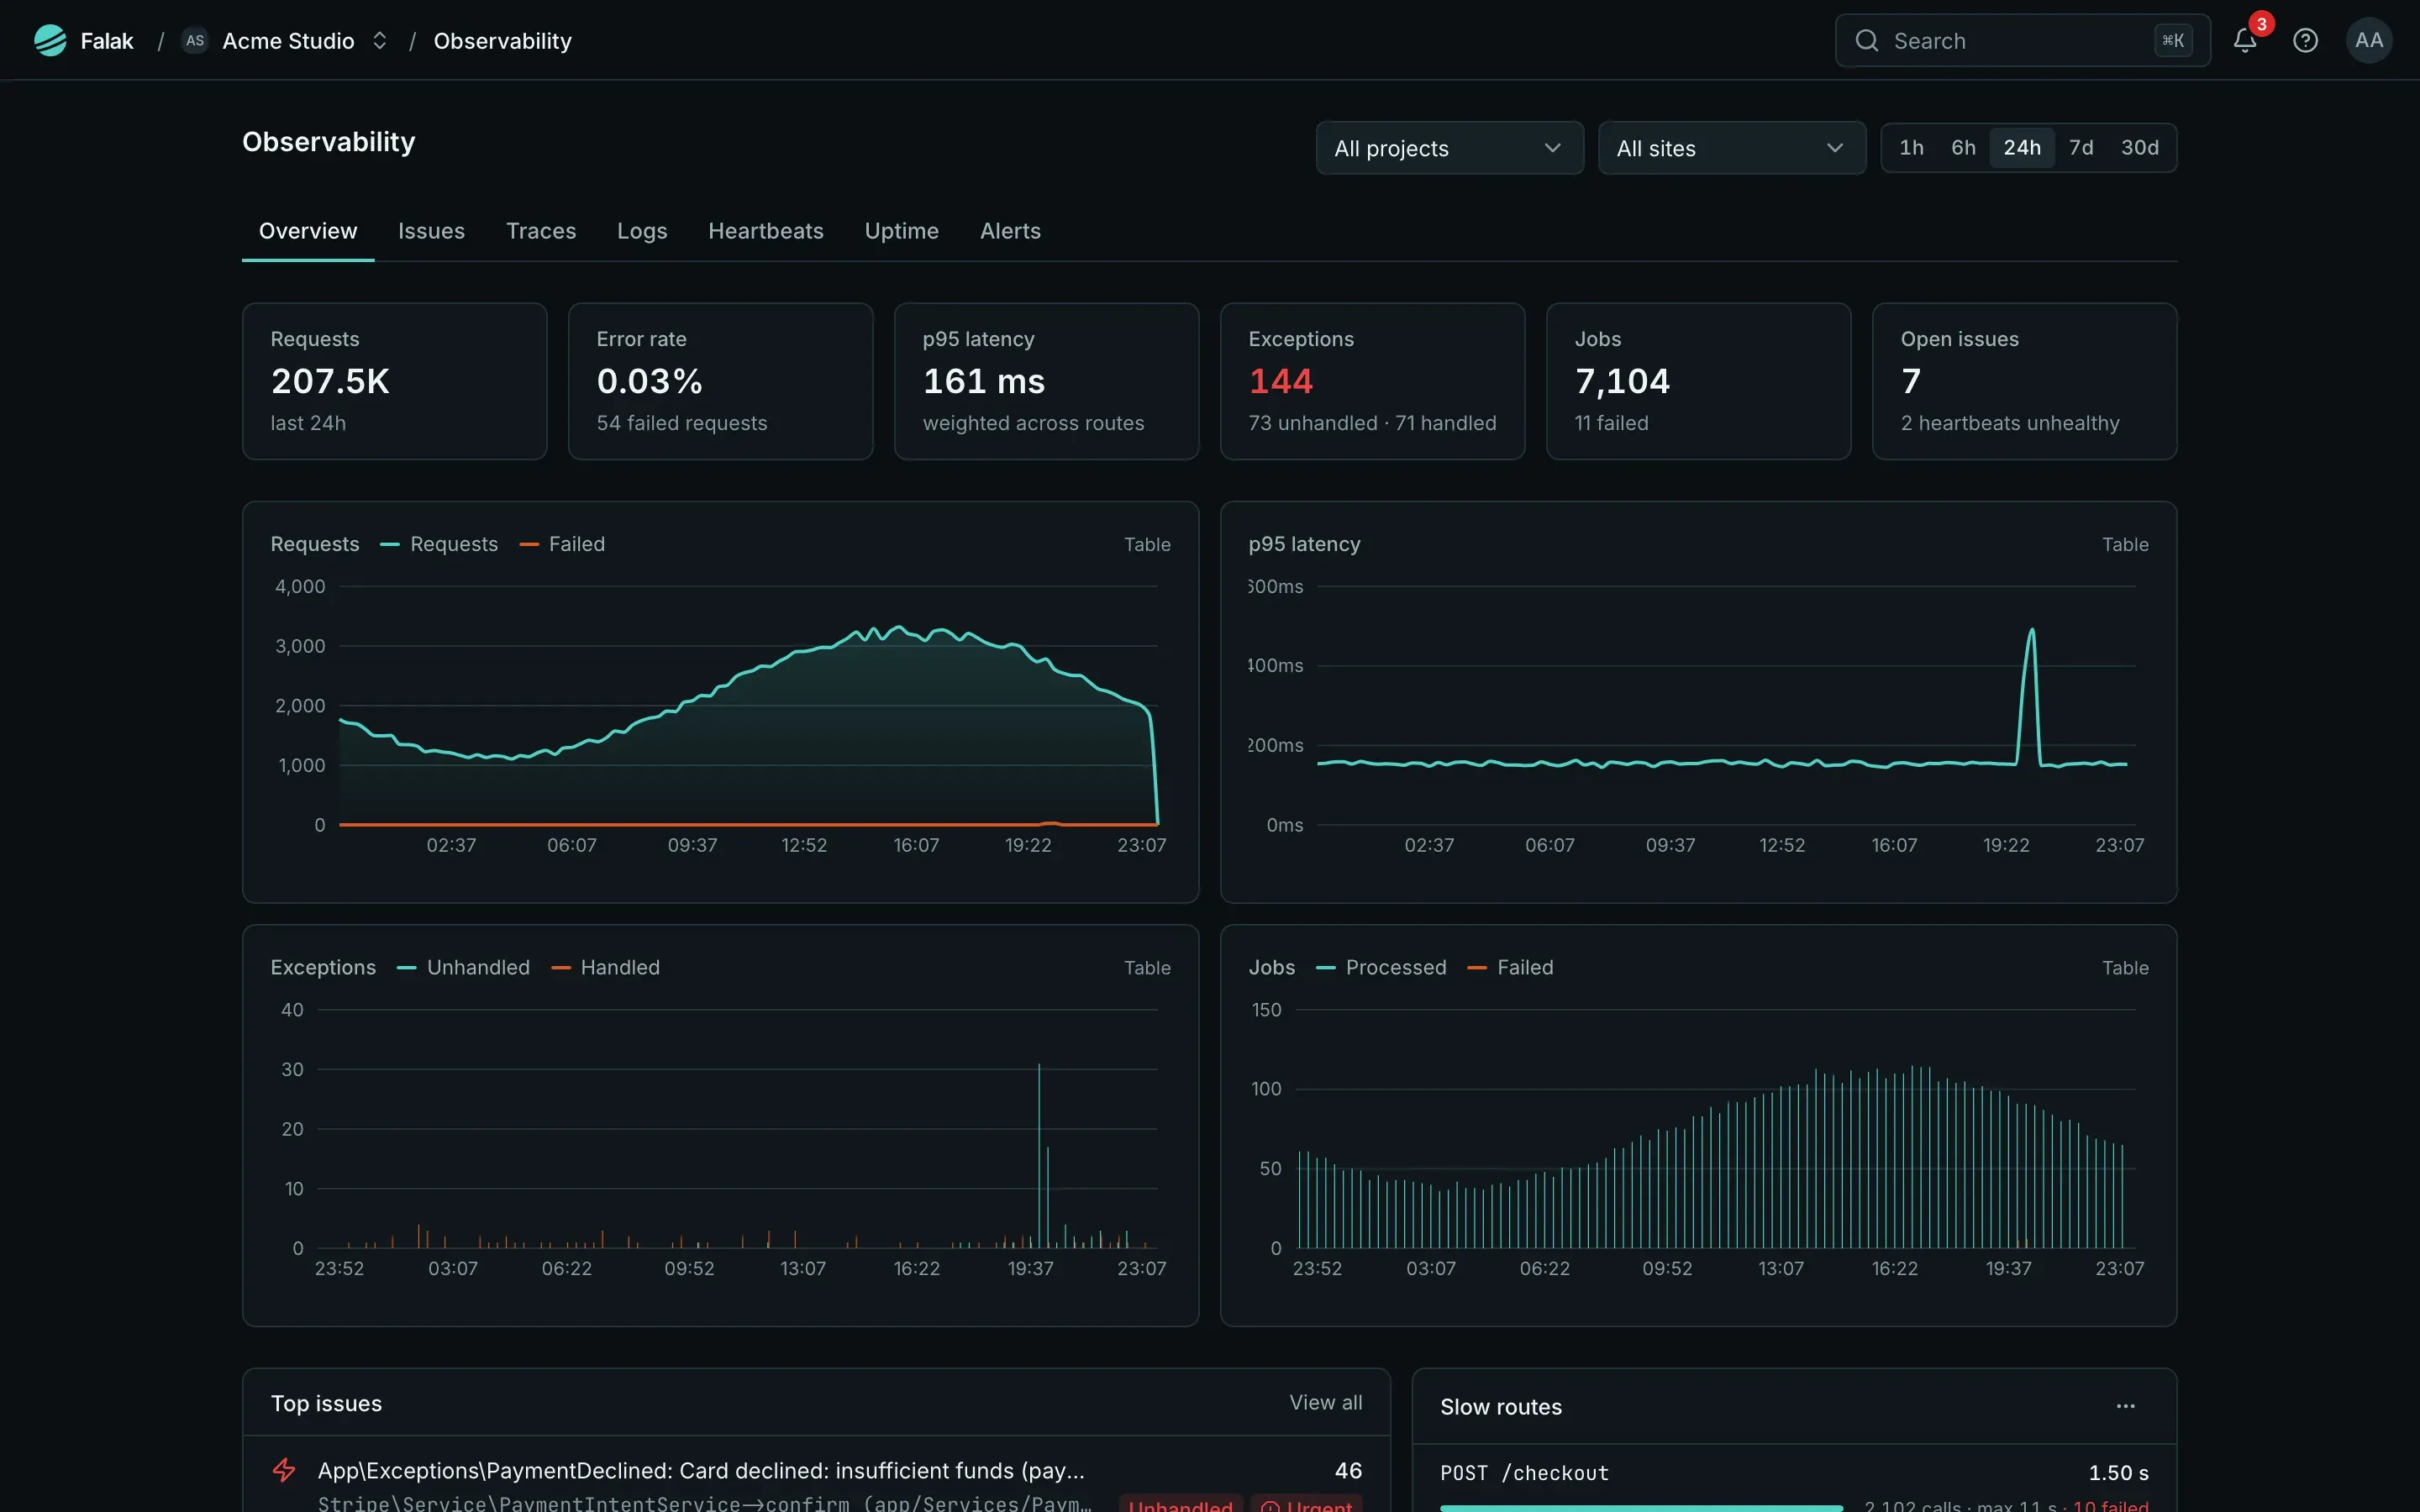
Section titled “Observability”Observability gathers the organization’s Overview, Issues, Traces, Logs, Heartbeats, Uptime and Alerts.
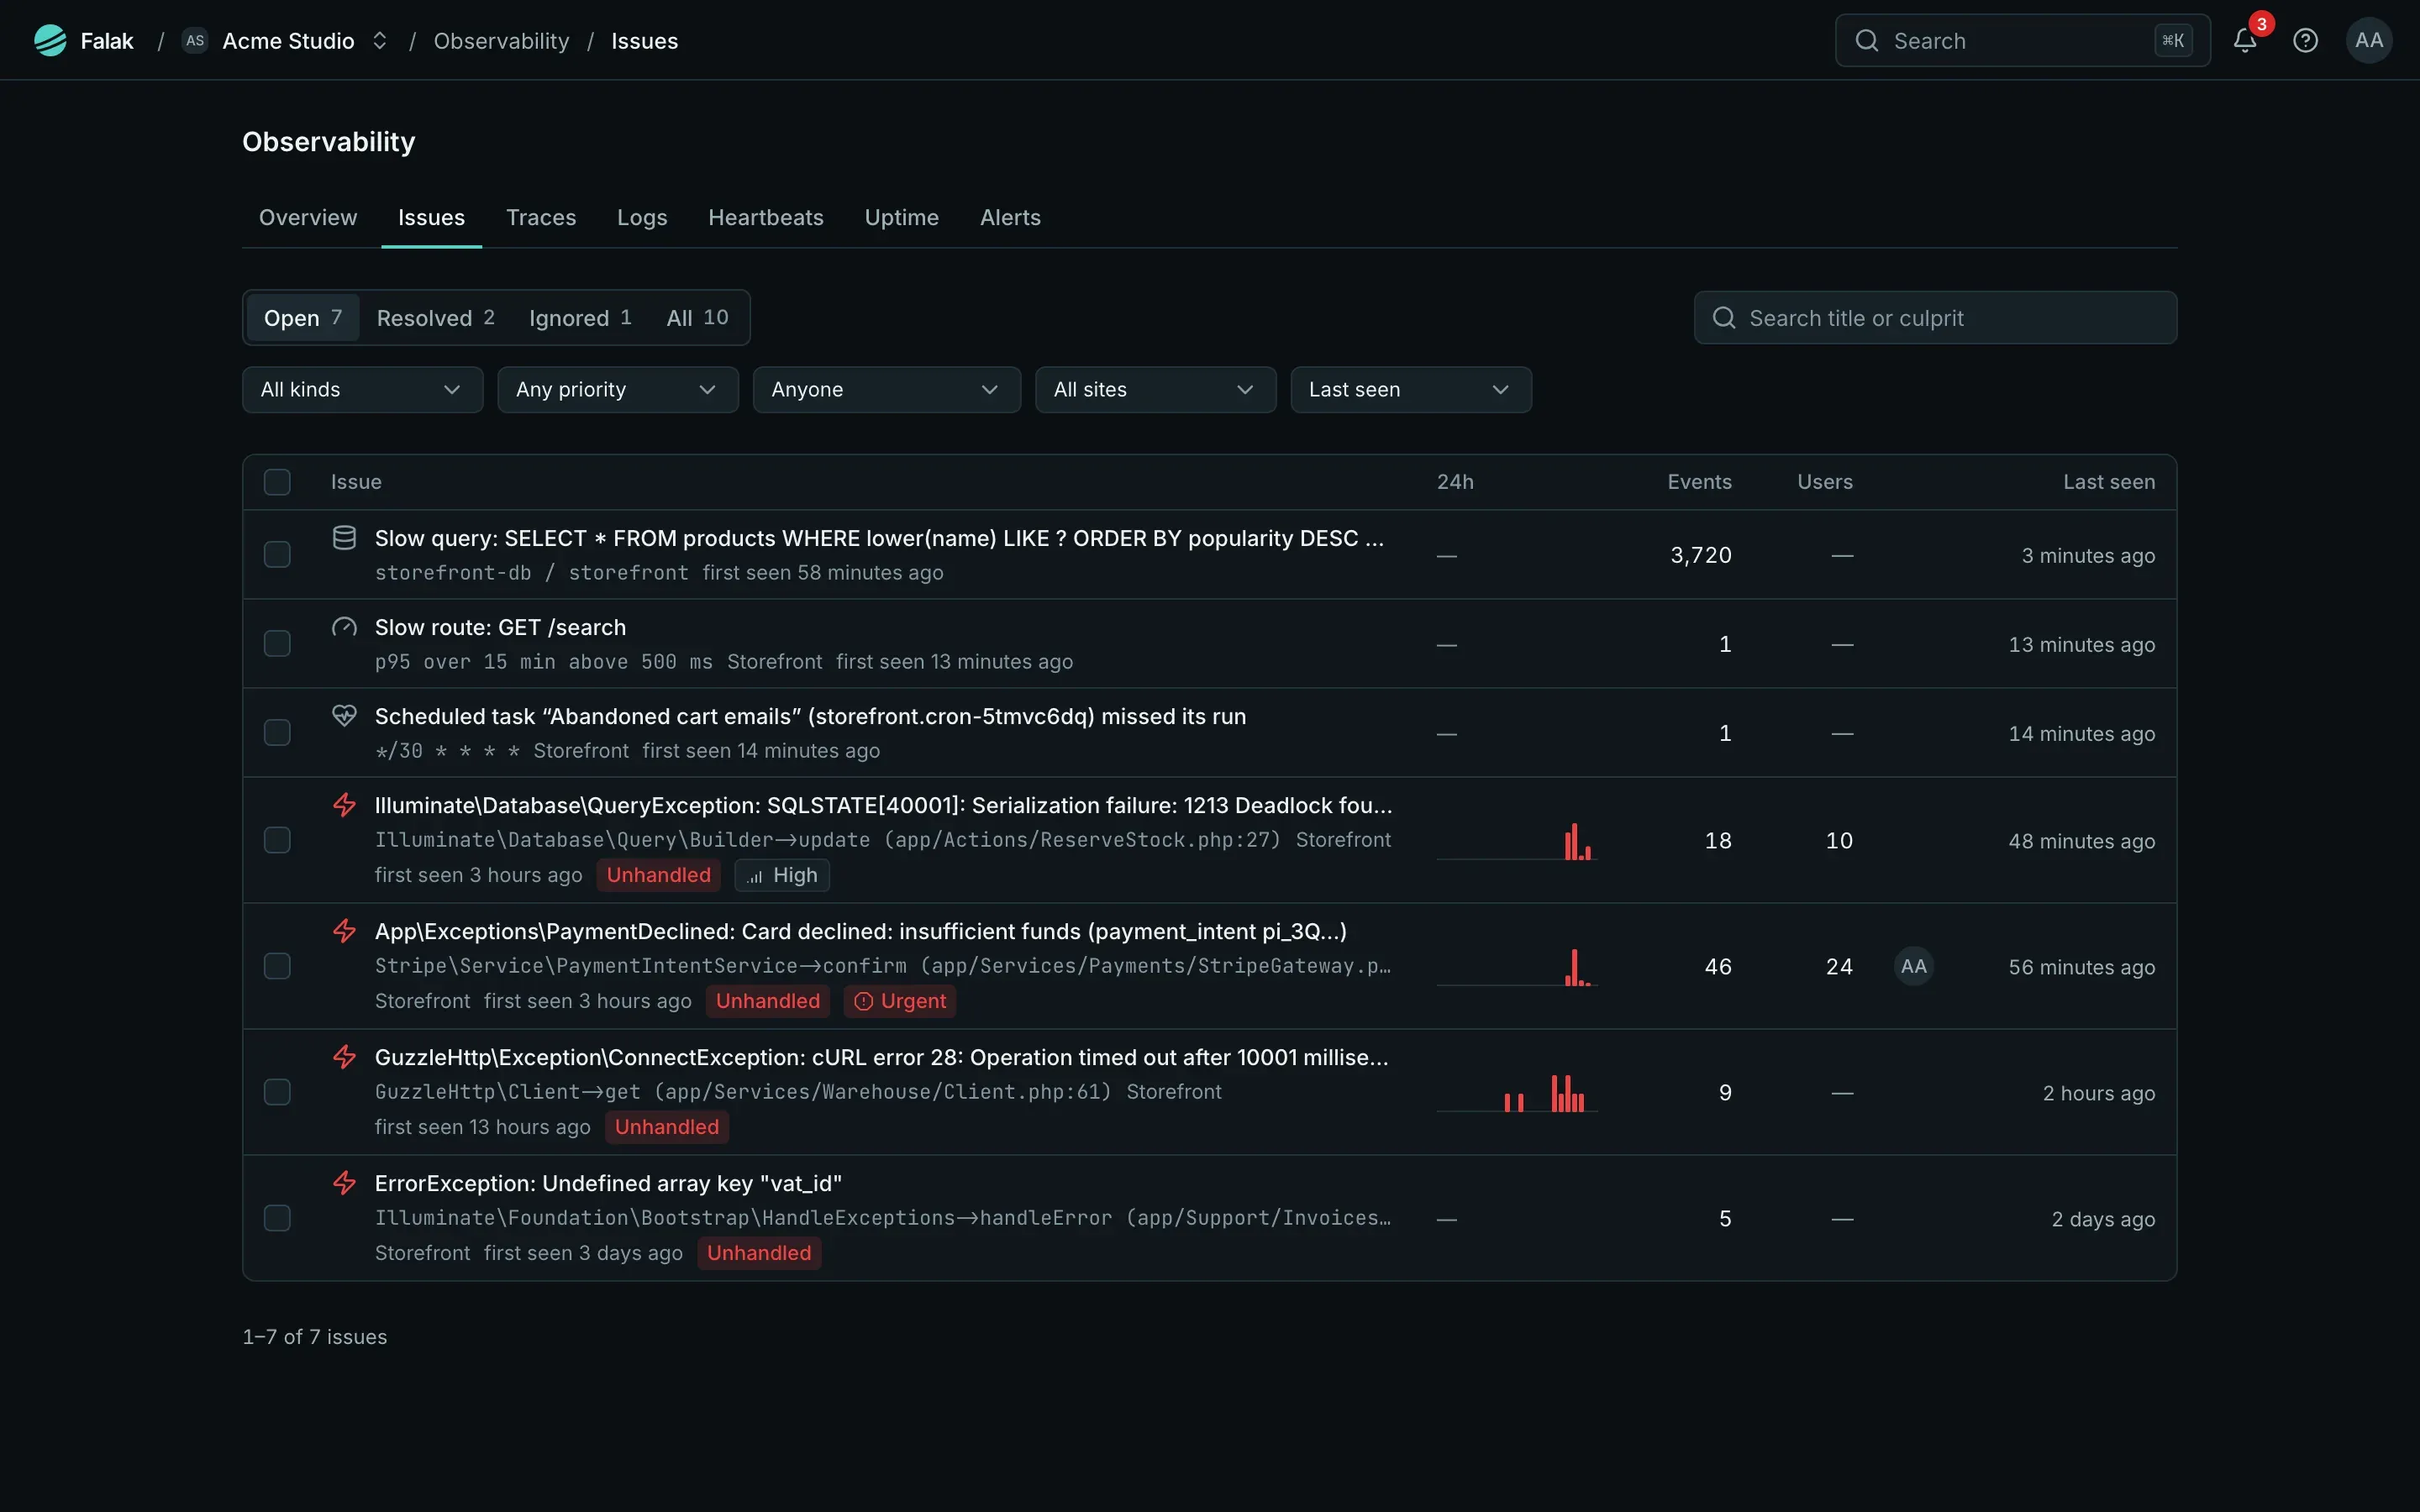
Issues come from exceptions, slow routes, missed scheduled tasks, slow queries, security findings and uptime incidents, in one list you can filter, assign and resolve:
See Insights and Uptime and status pages.
Network
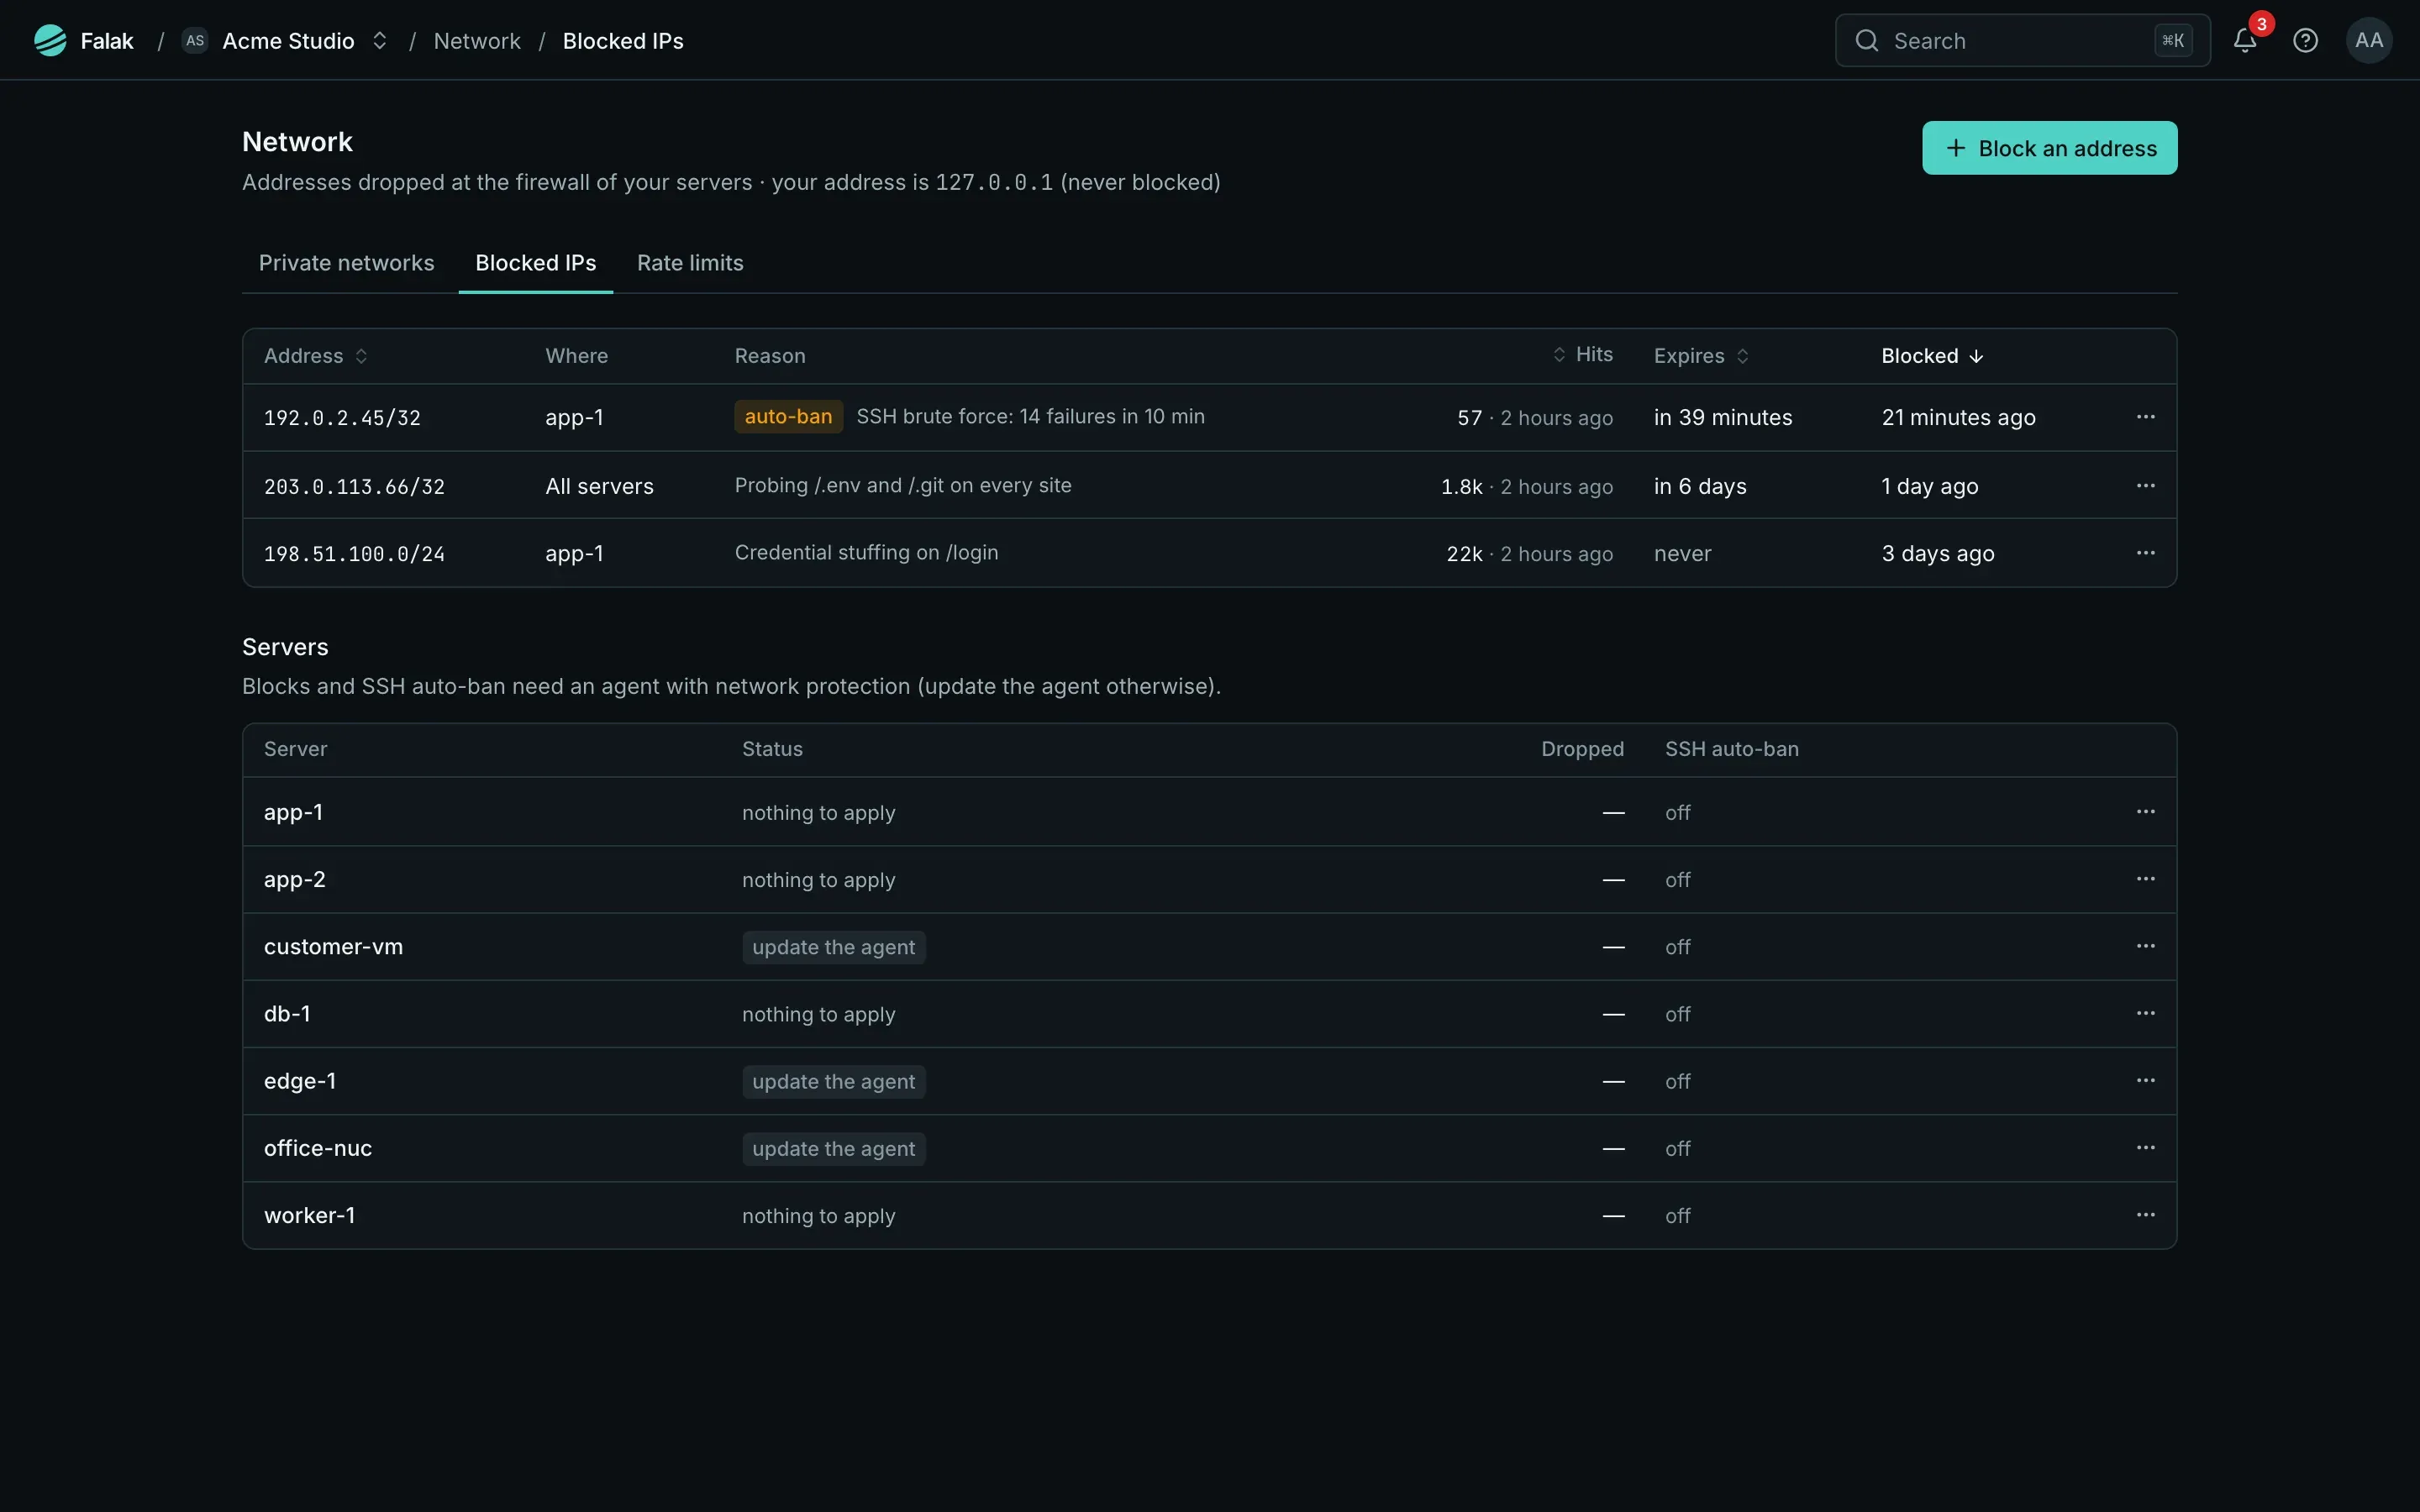
Section titled “Network”Network has three tabs: Private networks (WireGuard networks, firewalls and load balancers), Blocked IPs and Rate limits.
See Network protection.
Settings
Section titled “Settings”Settings covers your account (profile, password, two-factor auth, appearance, API tokens), the organization (general, members, teams, audit log, domains, secrets, compose policy, secret providers, alert rules, recipes, templates) and integrations (source control, cloud providers, Cloudflare, backup storage, builders and more).