Database metrics, logs and insights
Since v0.16.0 every managed database instance has Metrics, Logs and Insights tabs. Once a minute, a helper inside the database container (falak-db) reads what the engine knows about itself; the agent turns it into metrics, slow-query logs and a report for the control plane. Metrics and logs need the observability stack.
Metrics
Section titled “Metrics”| Engine | What you see |
|---|---|
| PostgreSQL | Transactions (commit / rollback), rows returned, fetched, inserted, updated and deleted, cache hit rate, connections by state (active, idle, idle in transaction) against max_connections, locks waiting, deadlocks, slow queries, temporary I/O, replication lag on replicas, the largest databases and tables |
| MySQL, MariaDB | Queries and operations (select / insert / update / delete), transactions, rows, buffer pool hit rate, connections (running, idle) against the maximum, row lock waits, deadlocks, slow queries, network bytes, the largest databases and tables |
| Redis, Valkey | Operations, hit rate, memory against maxmemory, evicted and expired keys, clients, keys per database |
| All | The instance container’s CPU and memory against its server and its limits |
Metrics are kept 30 days in VictoriaMetrics, as falak_db_* series with falak_db_instance_id. The tabs need databases.view; Metrics and Logs also need telemetry.view.
The Logs tab shows the engine’s output and the slow queries, with a filter (all, slow, engine) and a search.
- Slow-query threshold. Changing it reloads PostgreSQL, MySQL and MariaDB in place, with no restart. Redis and Valkey apply a new threshold at their next restart.
- Query text is normalized before it leaves the server: values become
?, lists collapse, comments go. Redis keeps only the command name and the number of keys (MGET <3 keys>). - No SQL text or values from PostgreSQL’s own output. Falak filters raw statements and bind parameters out of the shipped engine log; slow statements are shipped normalized.
Insights
Section titled “Insights”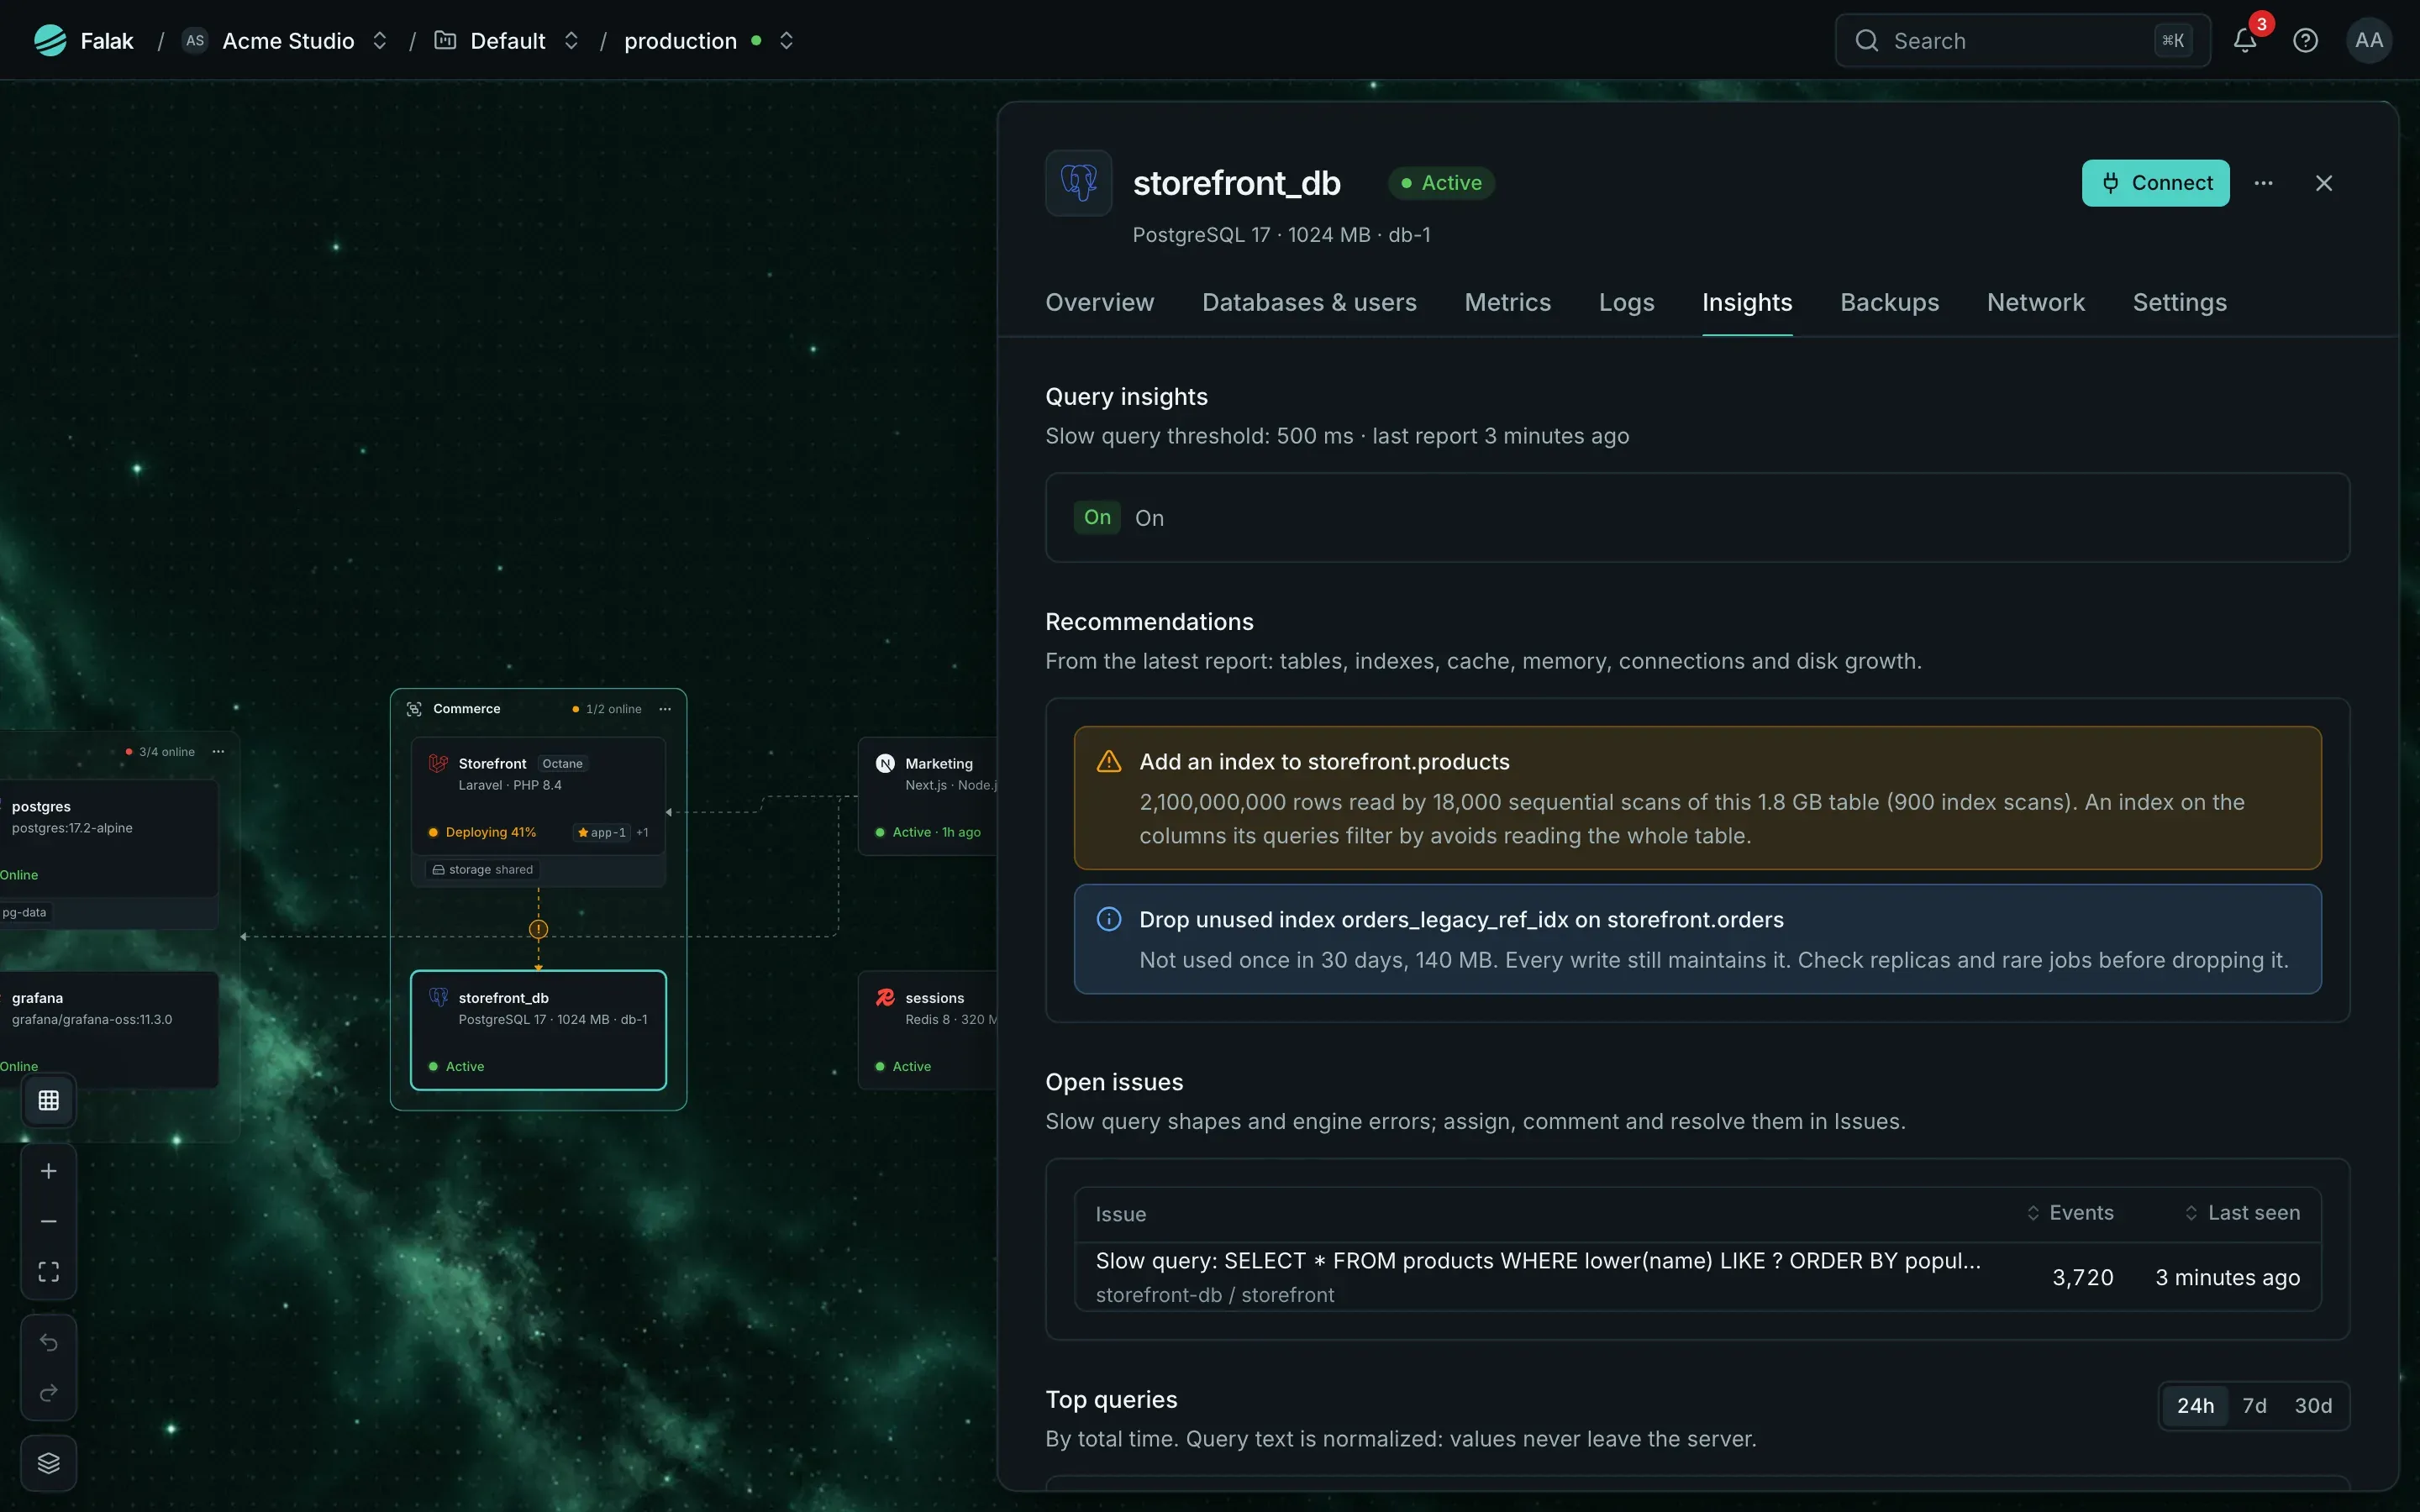
- Top queries, hour by hour for 30 days: calls, total, mean and max time, rows.
- Database Issues, in the same Issues list as your app’s: a repeated slow query shape (title Slow query: …), and engine errors such as deadlocks, too many connections, repeated failed logins, broken replication, out of memory, a full disk or a crash.
- Recommendations, computed from the latest report:
| Recommendation | When |
|---|---|
| Add an index | PostgreSQL: a large table scanned sequentially far more than through an index |
| Drop an unused index | An index unused for at least 7 days of statistics |
| Queries without an index | MySQL / MariaDB: top statements that used no index |
| Raise the memory | Cache hit rate below 95 % (PostgreSQL) or 99 % (InnoDB) |
Redis near maxmemory with noeviction |
Memory at 90 % or more: writes will be refused |
| Connections near the limit | 80 % or more of max_connections |
| Disk full in N days | Size samples of 14 days reach the volume size within 30 days |
| Enable query insights | PostgreSQL or MariaDB without them (below) |
Query insights need a restart you choose
Section titled “Query insights need a restart you choose”Top queries for PostgreSQL come from pg_stat_statements, and for MariaDB from performance_schema (instances with 1 GiB of memory and more). Both need a restart, so nothing restarts on its own:
- New instances get them from the start.
- Existing instances show Enable query insights (restarts the database) in the Insights tab. You choose when to press it.
- MySQL has
performance_schemafrom 1 GiB of memory. Without query insights, top queries come from the slow log.
Monitoring queries run with short statement and lock timeouts, so they don’t hold up your app.
Alerts
Section titled “Alerts”These join the Databases area of the default rule pack:
| Type | When |
|---|---|
databases.slow_queries_spike |
30 or more slow queries a minute, held 5 minutes |
databases.replication_lag |
Lag of 60 s or more, held 5 minutes |
databases.deadlocks |
Deadlocks in the last minute (at most once an hour per instance) |
databases.memory_high |
Redis / Valkey near maxmemory, or the container at 90 % of its memory limit, held 5 minutes |
Requirements
Section titled “Requirements”- Agent feature
db.observability(v0.16.0). Upgrading the control plane or the agent never restarts or recreates a running database.