APM for Laravel
falak/apm-laravel is Falak’s Nightwatch-style instrumentation for Laravel 11, 12 and 13 (PHP 8.2+). It records what your app does and sends it to the local agent as OTLP/HTTP JSON, after the response is sent. Traces go to Tempo; exceptions and slow operations become Insights issues.
Install
Section titled “Install”-
Require the package:
Terminal window composer require falak/apm-laravel -
Optionally publish the configuration:
Terminal window php artisan vendor:publish --tag=falak-apm-config -
Commit and deploy. On a Falak server nothing else is needed: the service provider is auto-discovered and sends to
unix:/run/falak/otlp.sock, falling back tohttp://127.0.0.1:4318.
What it captures
Section titled “What it captures”| Event type | Captured from | Key attributes |
|---|---|---|
request |
Global middleware | method, route, status, path, user id, route name/action; 5xx → error. Timeline spans bootstrap → middleware → controller → response |
query |
QueryExecuted |
SQL with placeholders only (bindings are never captured, quoted literals stripped), connection, repeat count for N+1 detection |
job |
Queue events | queue, job class, attempt, status (processed, released, failed). Each async job is its own trace, linked to the dispatching request |
outgoing_request |
Laravel Http client |
method, URL (query redacted), status, host; sends traceparent |
mail |
MessageSending / MessageSent |
mailable class, recipient count, mailer |
notification |
Notification events | class, channel, status |
cache |
Cache events | operation (hit, miss, write, forget), key, store |
command |
Artisan commands | name, exit code (non-zero → error) |
scheduled_task |
Scheduler events | name, cron expression, status |
| exceptions | reportable() + shutdown handler |
type, message, stack trace, handled/unhandled, the user |
| logs | Laravel’s logger | level, message, redacted context, trace and span ids |
Performance guarantees
Section titled “Performance guarantees”- The hot path only appends small structs; redaction, N+1 analysis and JSON encoding happen at flush time.
- Flushes happen after the response is sent (
terminating), after each queue job, after each command and scheduled task, on Octane’sRequestTerminated, and in a shutdown safety net. - Transport is HTTP/1.1 over a socket with a 250 ms budget. If the agent is down, the payload is dropped silently; the package never throws into your app.
- No OpenTelemetry SDK,
ext-grpcorext-protobufneeded. Octane state is reset per request, task and tick.
Configuration
Section titled “Configuration”config/falak-apm.php:
| Key | Env | Default |
|---|---|---|
enabled |
FALAK_APM_ENABLED |
true |
service_name |
FALAK_SERVICE_NAME / OTEL_SERVICE_NAME |
slug of app.name |
socket |
FALAK_OTLP_SOCKET |
unix:/run/falak/otlp.sock |
fallback_endpoint |
FALAK_OTLP_ENDPOINT |
http://127.0.0.1:4318 (null disables) |
timeout |
FALAK_APM_TIMEOUT |
0.25 s |
sample_rates.{request,job,command,scheduled_task} |
FALAK_APM_*_SAMPLE_RATE |
1.0 (whole trace kept or dropped) |
sample_rates.{query,outgoing_request,cache,mail,notification} |
1.0 (per span) |
|
sample_rates.logs |
FALAK_APM_LOG_SAMPLE_RATE |
1.0 |
events.* |
all true; a disabled type registers no listeners |
|
timeline |
true |
|
max_spans_per_trace |
FALAK_APM_MAX_SPANS |
1000 |
max_logs, log_level, logs_via |
FALAK_APM_LOG_LEVEL, FALAK_APM_LOGS_VIA |
1000, debug, listener |
redaction.keys |
password, token, secret, authorization, cookie, api_key |
|
redaction.cache_keys |
[] (Str::is patterns) |
|
redaction.query_literals |
true |
|
ignore.paths / ignore.commands / ignore.jobs |
up, telescope*, horizon*… / queue:work, horizon, octane:*… / [] |
Resource attributes come from FALAK_ORG_ID, FALAK_SITE_ID, FALAK_SERVER_ID, FALAK_DEPLOYMENT_ID and FALAK_RELEASE_ID, which Falak injects into every release.
Custom redaction
Section titled “Custom redaction”app(\Falak\Apm\Recorder::class)->redactUsing(function (array $attributes, string $type) { unset($attributes['client.address']); return $attributes;});Send only some log channels
Section titled “Send only some log channels”Set FALAK_APM_LOGS_VIA=handler and add the Monolog handler to the channels you want:
'channels' => [ 'falak' => ['driver' => 'monolog', 'handler' => Falak\Apm\Logging\OtlpHandler::class],],Where to see the data
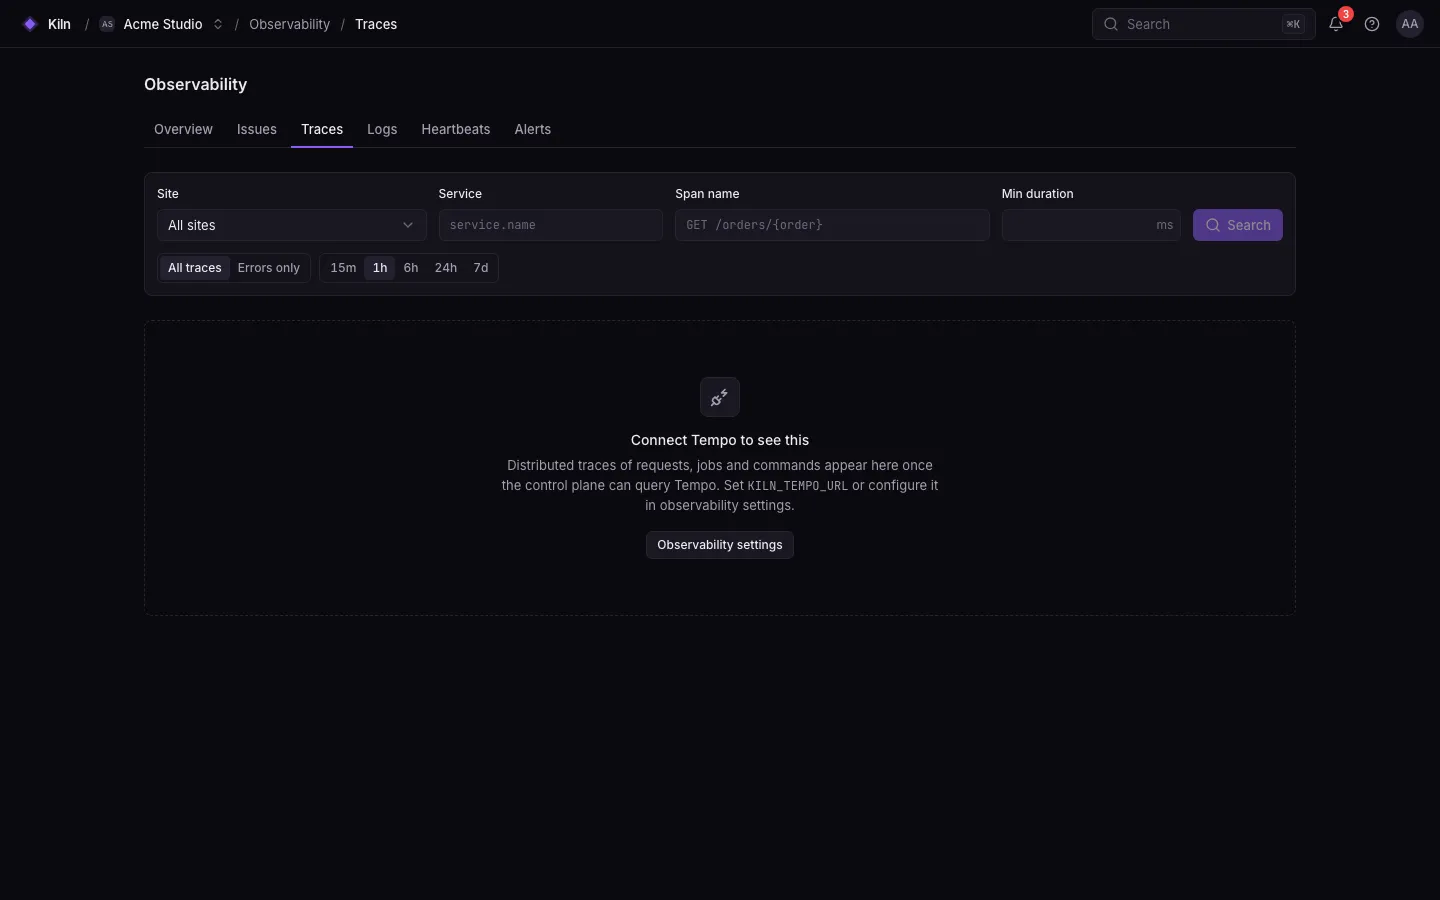
Section titled “Where to see the data”- Observability → Traces: request and job traces with their timelines.
- Observability → Issues: grouped exceptions and threshold breaches. See Insights.
- The service panel’s Observability tab: this site’s issues, slow routes, jobs and queries.
- Grafana: the “Laravel site” and “Queues” dashboards.