Network tools
Since v0.17.1 you can debug the network from where your app actually runs: a server’s host network, or the network namespace of a site’s or database’s container. Output streams live. The tools only read: nothing here changes traffic.
| Tool | Does | Options |
|---|---|---|
ping |
Echo requests | count 1–20 (default 4) |
traceroute |
The route to a host (traceroute, else mtr, else tracepath) |
max hops 1–30 (default 20) |
dns |
A lookup with the resolver there | type A, AAAA, CNAME, MX, TXT, NS, SRV, PTR (default A); an optional nameserver IP |
http |
A request with a timing breakdown (DNS, connect, TLS, first byte, total), headers like curl -v, TLS version, cipher and certificate chain; the body is counted, not printed |
method GET or HEAD; connect to an IP (test an origin behind Cloudflare); skip certificate verification |
tcp |
Connection attempts to host:port, one line each with the time or the error |
count 1–10 (default 3) |
Every tool stops after its timeout (1–60 s, default 30). Output is capped at 256 KiB.
Where they run
Section titled “Where they run”| Target | Runs in |
|---|---|
| Server | Its host network |
| Native site | The host network (native sites use it) |
| Docker site | Its newest running container’s network namespace |
| Compose site | The chosen service’s container |
| Database instance | Its container |
| Function | Refused: functions have no network of their own |
Inside a container only the network namespace changes, so the image needs none of the tools. Names resolve the way the app resolves them: the container’s DNS settings and hosts file (read from Docker’s host-side copies), so compose service names and extra_hosts work.
Run one
Section titled “Run one”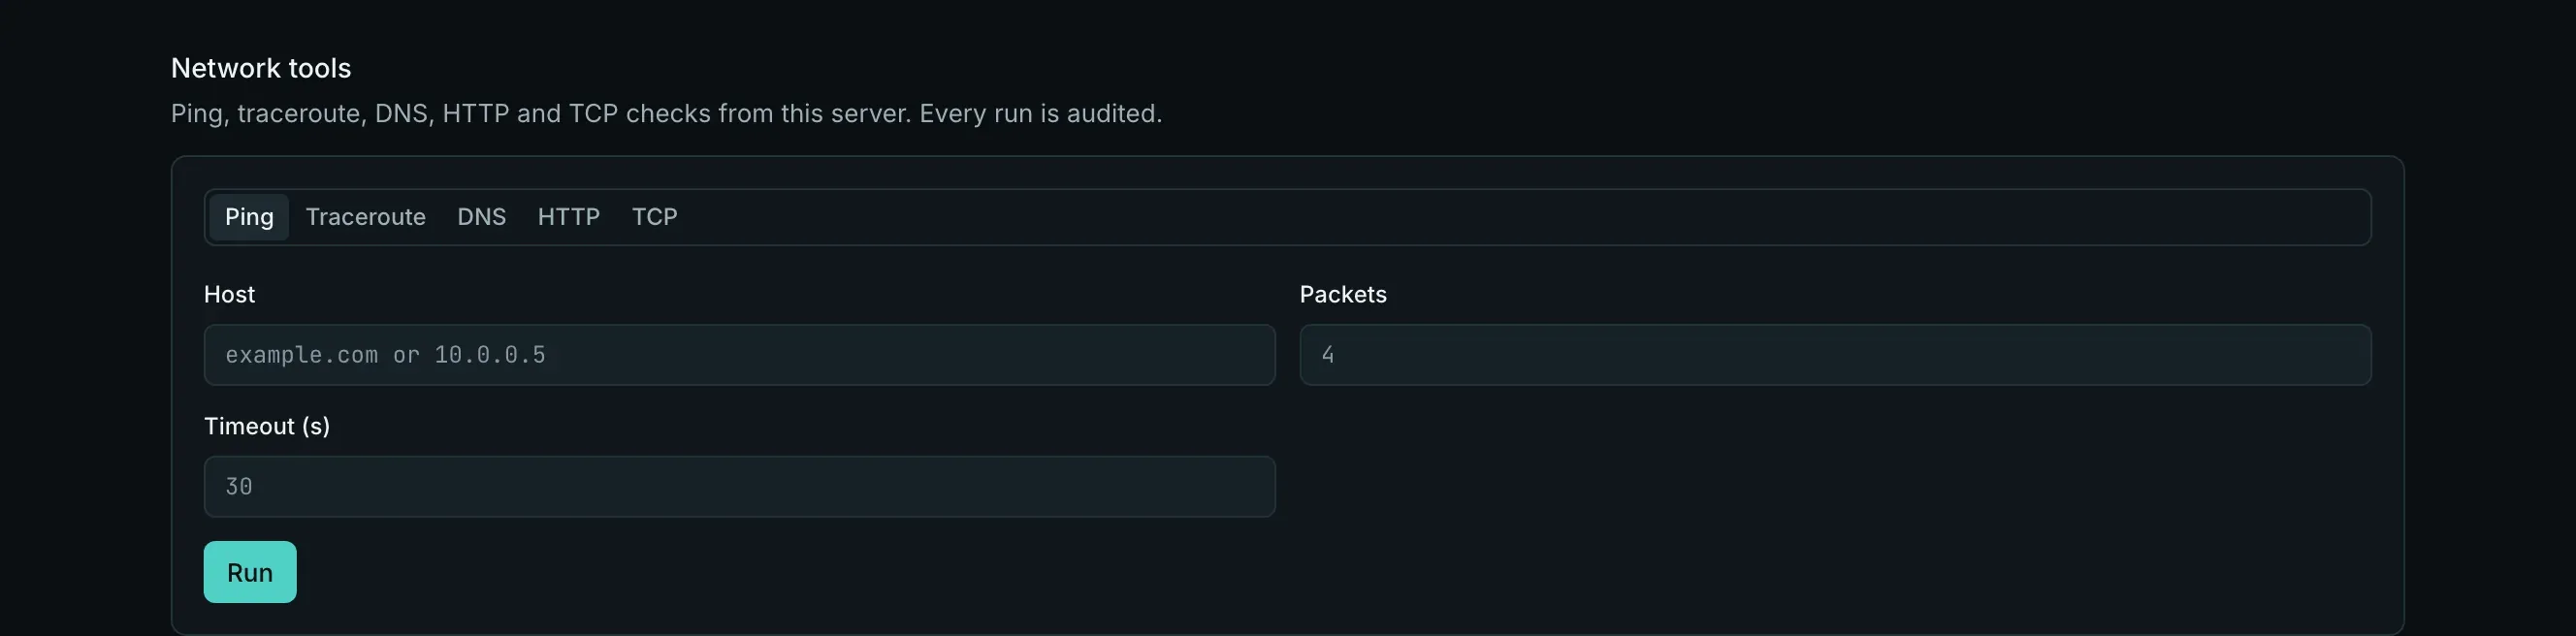
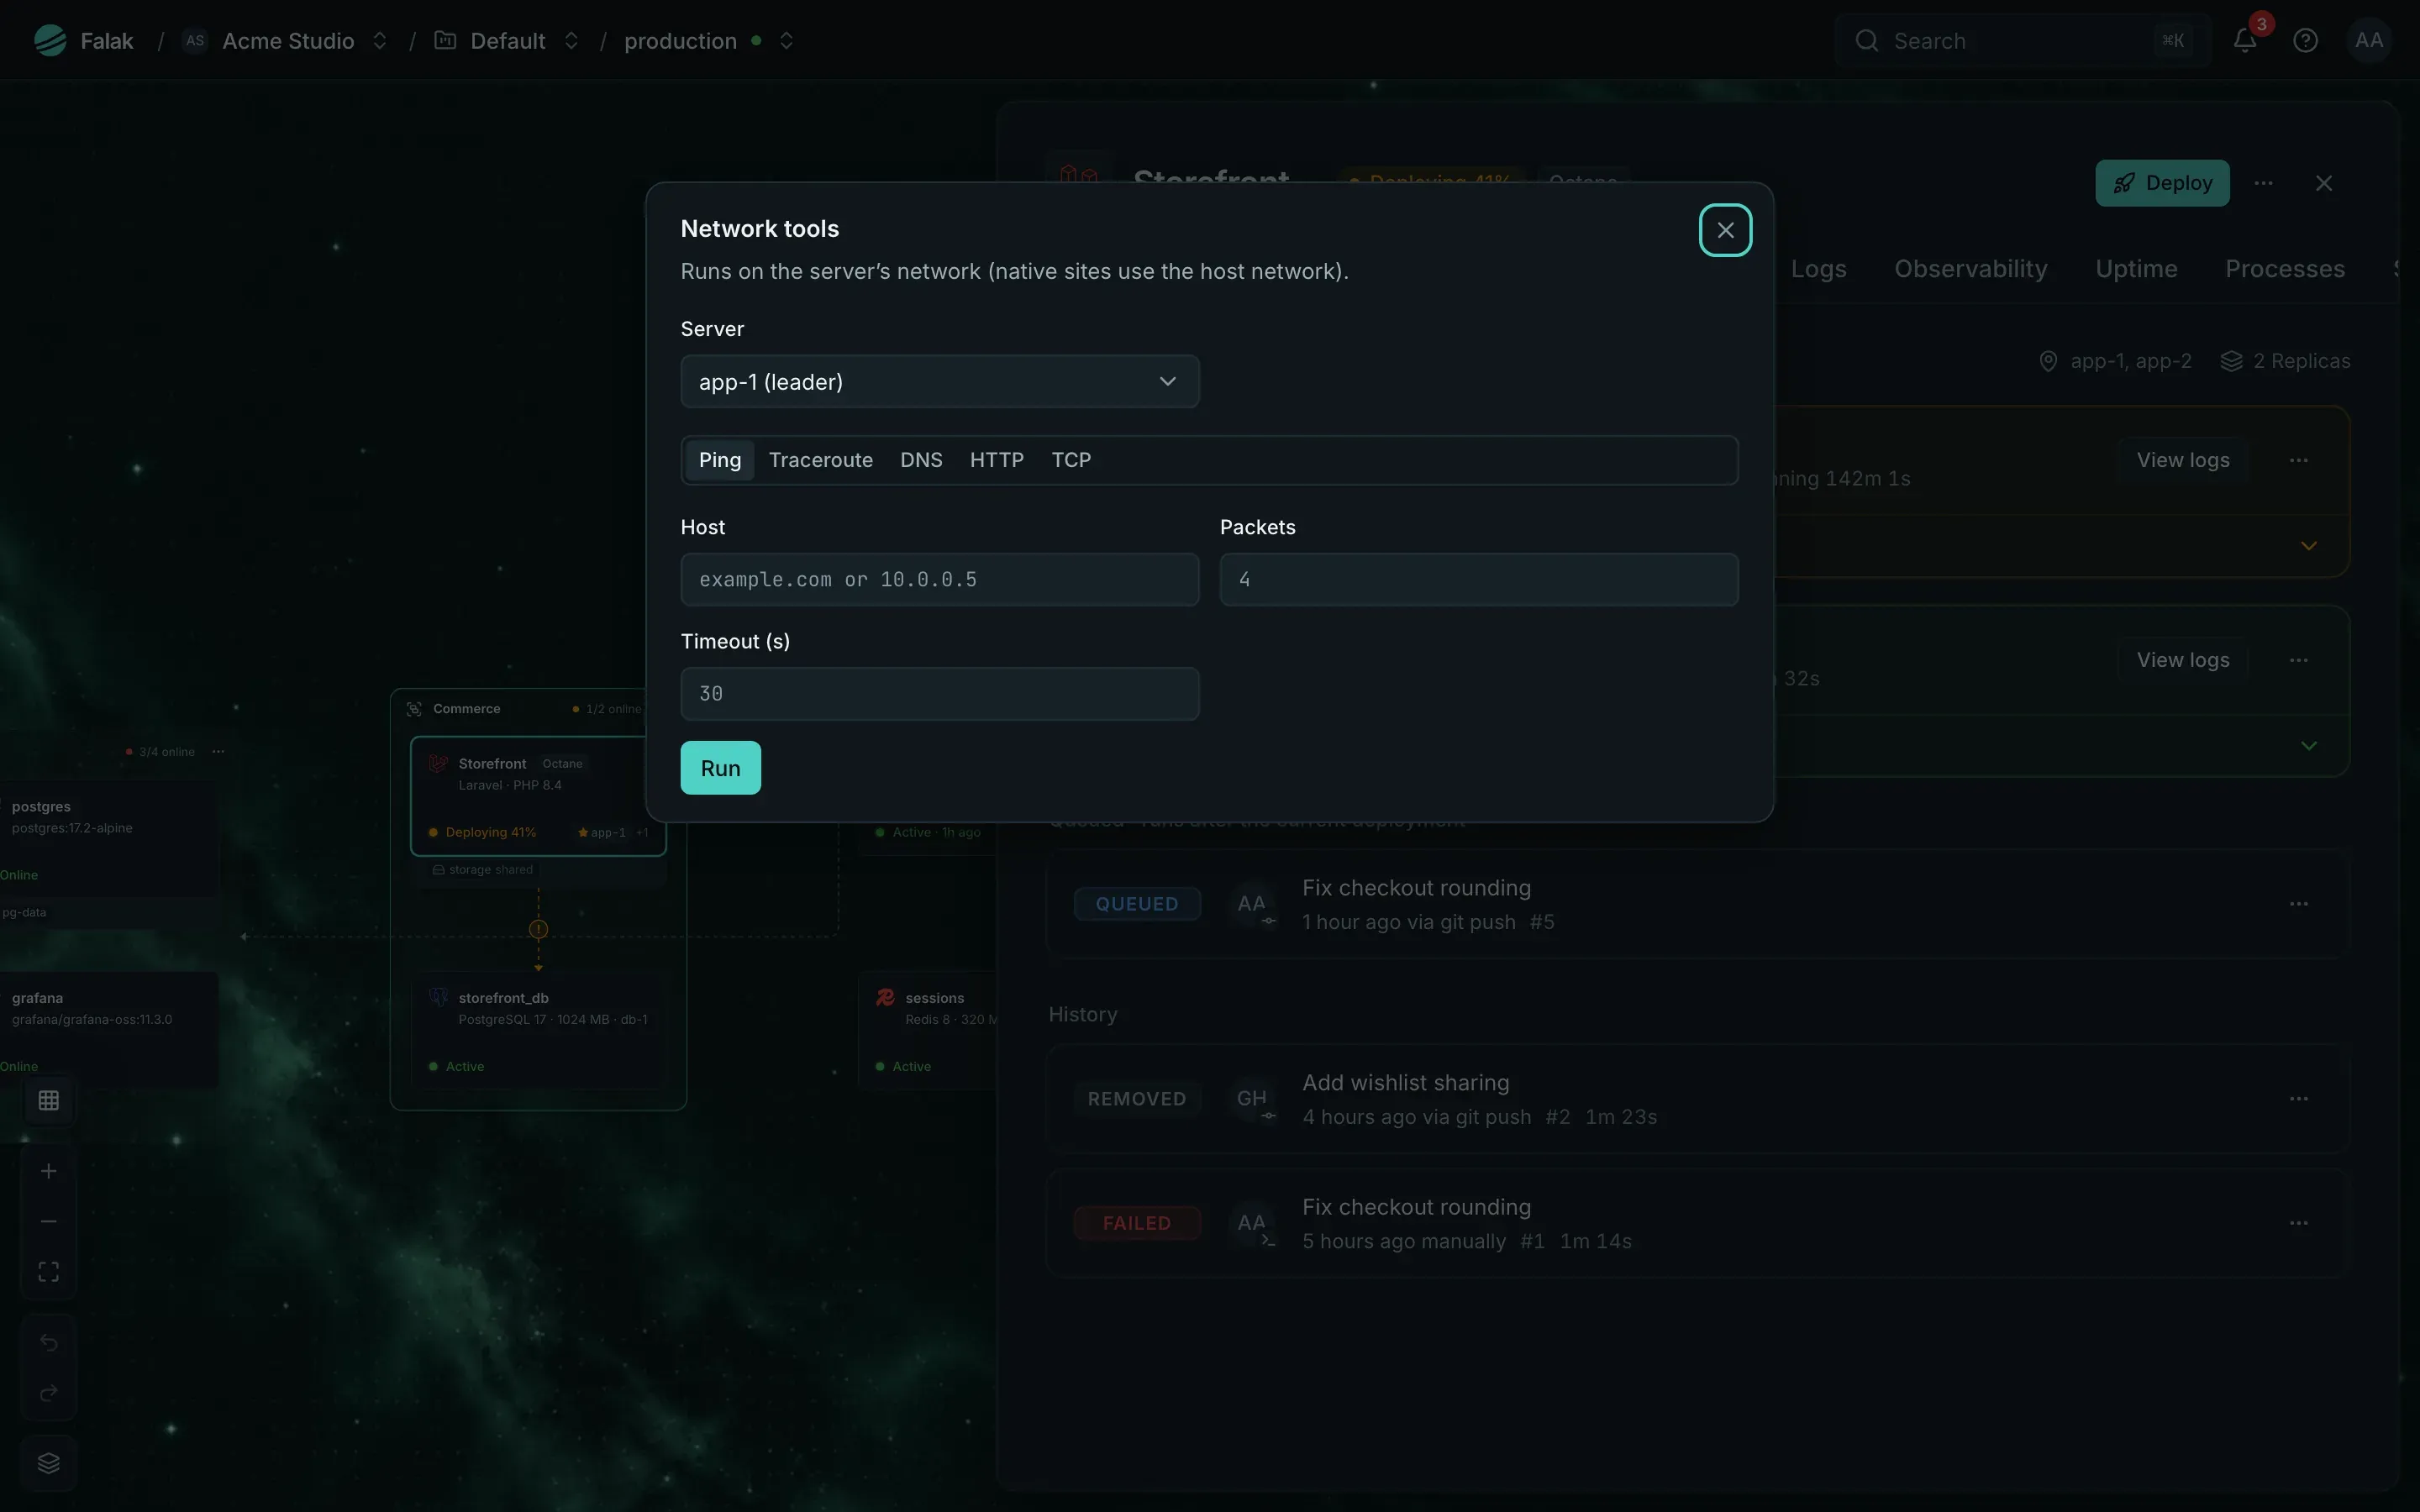
- Server: the Network tools section at the bottom of the server’s Network tab.
- Site: the site panel’s ⋯ → Network tools. Pick the server (sites on several) and the service (compose), choose a tool, fill its fields and click Run. Your last runs for the target can be opened again.
- Database containers: the CLI and API for now.
falak net ping 1.1.1.1 --server app-1falak net dns api.stripe.com --site shop --service webfalak net http https://shop.example.com/health --site shop --connect-to 203.0.113.10falak net tcp smtp.example.com 587 --site shop --count 5falak net traceroute example.com --db shop-db --max-hops 15One of --server, --site (with --on SERVER and --service NAME) or --db is required. The CLI prints output as it arrives and exits with the tool’s exit code (124 on a timeout, 127 when the tool isn’t installed). --json prints the settled run with its output.
POST /api/v1/servers/{server}/net-tools, POST /api/v1/sites/{site}/net-tools or POST /api/v1/databases/instances/{instance}/net-tools, then poll GET /api/v1/net-tools/runs/{run}?after=<seq>. See Consoles and network tools API.
Rules and limits
Section titled “Rules and limits”- Admins only by default: permission
network.tools. A site or database target also needssites.view/databases.view. - Every run is audited (
network.tool_run) with the tool, target and arguments. - 10 runs a minute and 2 running at once per user; at most 4 tools at once per server.
- Arguments are validated on both sides and passed without a shell.
httpandtcprefuse link-local addresses (169.254.0.0/16, fe80::/10), which covers cloud metadata endpoints. - If
pingor every traceroute binary is missing, the run says which package to install. Ubuntu shipspingandtracepath.