Metrics
The agent reads host metrics from /proc, container metrics from docker stats, and forwards metrics your apps send over OTLP. They are stored in VictoriaMetrics (default) or Mimir and shown in Falak and Grafana.
Where to look
Section titled “Where to look”| View | Shows |
|---|---|
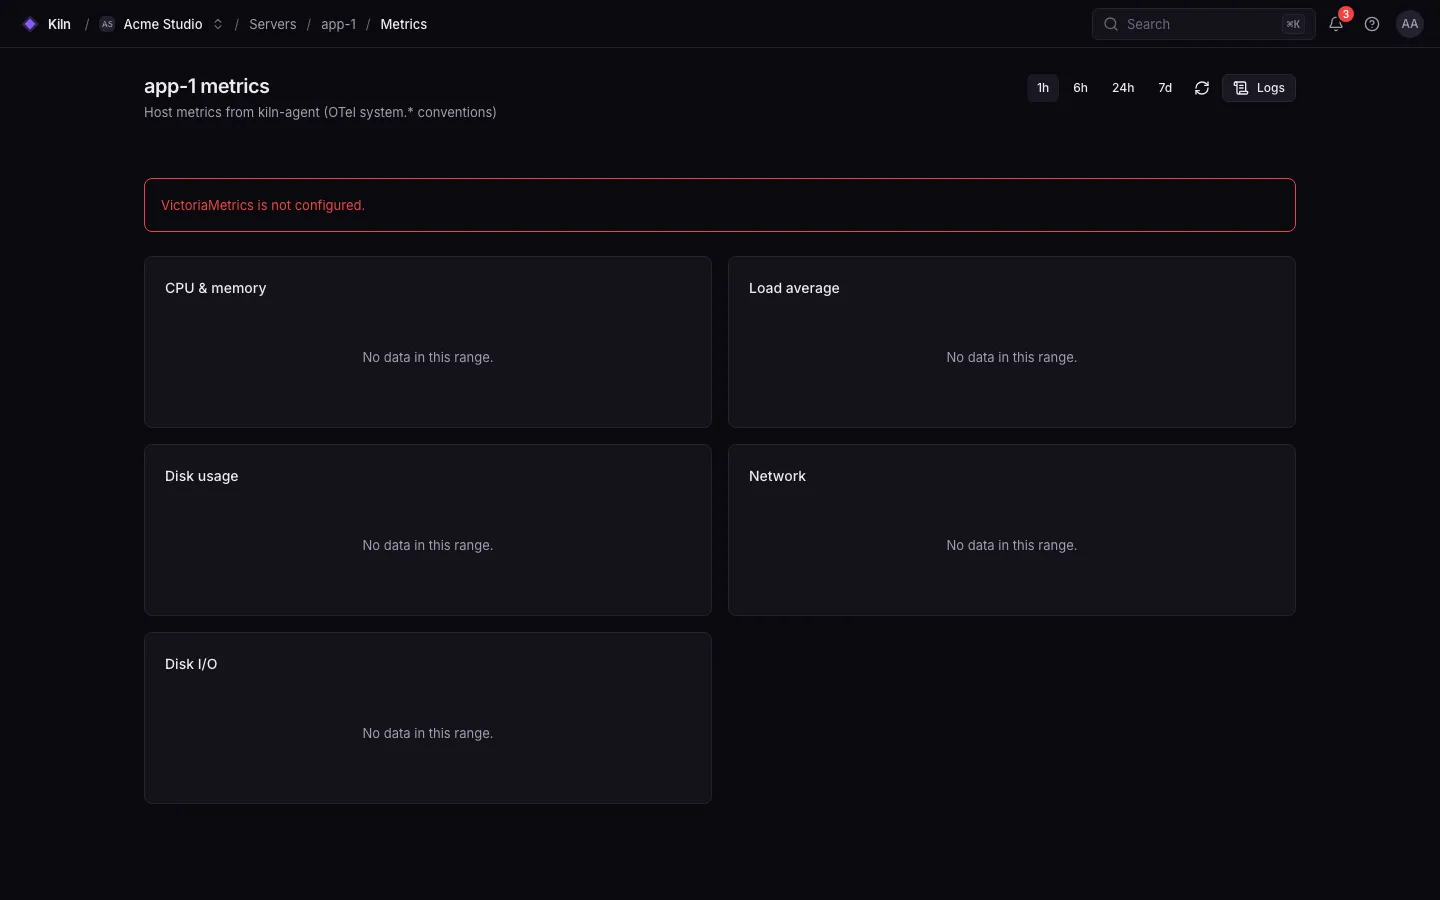
| Server page → Metrics | CPU, memory, disk, load, network and disk I/O for one server |
| Service panel → Metrics | Requests, p95 latency, errors, CPU and memory per server (1h / 6h / 24h / 7d) |
| Servers list | Current load, memory and disk percentages |
| Grafana | Server, Laravel site, Node app, Containers, Queues and Deployments dashboards |
Host metric names
Section titled “Host metric names”Metrics follow OpenTelemetry semantic conventions, exported to Prometheus naming:
| Metric | Meaning |
|---|---|
system_cpu_utilization_ratio |
CPU utilization (0–1) |
system_cpu_time_seconds_total |
CPU time by cpu_mode |
system_cpu_load_average_1m, _5m, _15m |
Load averages |
system_memory_usage_bytes |
Memory by system_memory_state |
system_memory_utilization_ratio |
Memory utilization |
system_filesystem_utilization_ratio |
Disk utilization by system_filesystem_mountpoint |
system_network_io_bytes_total |
Network bytes by network_io_direction |
system_disk_io_bytes_total |
Disk bytes by disk_io_direction |
Filter by host_name.
avg by (host_name) (system_cpu_utilization_ratio)max by (host_name, system_filesystem_mountpoint) (system_filesystem_utilization_ratio) > 0.85Container metrics (Compose)
Section titled “Container metrics (Compose)”| OTLP metric | Meaning |
|---|---|
falak.container.cpu.utilization |
CPU per container |
falak.container.memory.usage, falak.container.memory.limit |
Memory per container |
falak.container.network.io |
Network I/O per container |
Intervals and backends
Section titled “Intervals and backends”| Setting | Default |
|---|---|
| Metrics interval | 15 s (organization setting, 5–3600 s) |
| Backend | victoriametrics (FALAK_METRICS_BACKEND), or mimir with FALAK_MIMIR_TENANT |
| Query URL | FALAK_METRICS_QUERY_URL (the installer sets http://gateway:9090/prometheus) |
| Retention | 30 days (FALAK_METRICS_RETENTION) |
Deployments add a Grafana annotation and a deployment.id resource attribute, so you can see metric changes around each deploy.