Insights
Insights is Falak’s application-level view: which exceptions happen, which routes, jobs and queries are slow, and which scheduled tasks did not run. It is fed by the APM packages, by cron heartbeats from the agent and, since v0.15.0, by Falak itself: Laravel log files, the edge, databases, the network and uptime checks.
Issues
Section titled “Issues”An issue groups occurrences of the same problem.
| Kind | Created when |
|---|---|
exception |
An exception is reported by the APM package, or found in a Laravel log file (no APM needed); grouped by its normalized type and top 3 in-app stack frames |
performance |
A threshold is breached, or a route is slow at the edge |
heartbeat |
A scheduled task misses its run |
database |
A slow query shape or an engine error on a managed database |
security |
An exposed port, a scanner or SSH brute force |
uptime |
A monitor is down, or its certificate has a problem |
Issues the monitoring itself can close (exposed ports, slow endpoints, outages) resolve automatically once the problem is gone, and regress if it returns.
Each issue has a status (open, resolved, ignored), a priority (none, low, medium, high, urgent), an assignee, comments, a timeline of occurrences and the affected users.
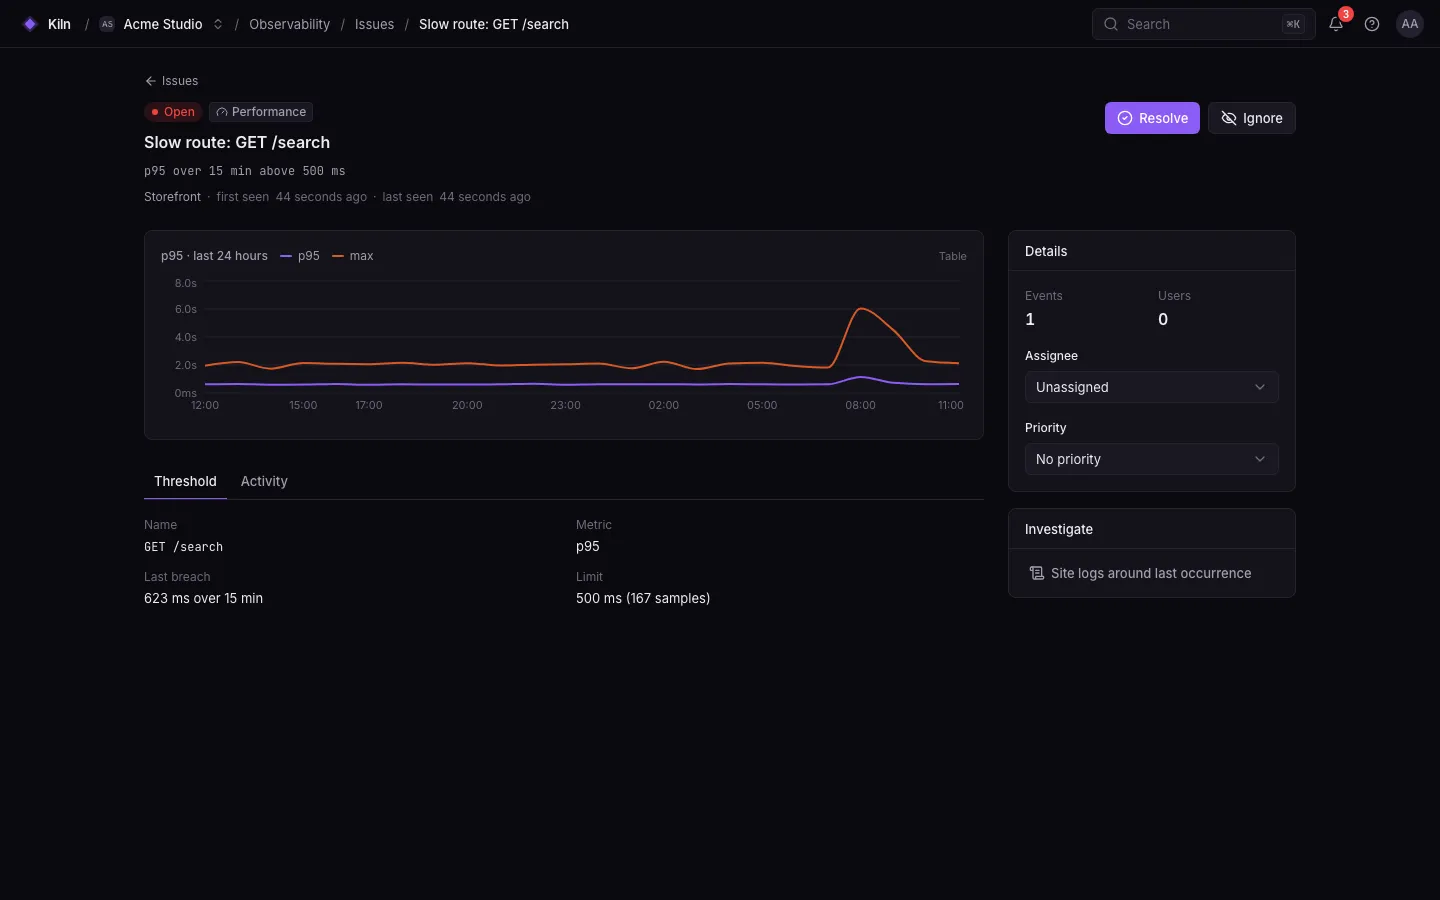
- Open Observability → Issues (or the site’s Observability tab).
- Filter by status and kind.
- Open an issue to see the stack trace, the request or job, and the timeline.
- Resolve, ignore, assign, set priority or comment (
insights.manage).
A resolved issue that happens again regresses and reopens.
Stored sizes: message up to 4 KiB, stack trace up to 16 KiB.
Thresholds
Section titled “Thresholds”Thresholds turn slowness into issues. Configure them per site (service panel → Observability, or Observability → Issues settings):
| Field | Allowed values |
|---|---|
| Event type | Routes (request), Jobs (job), Queries (query), Commands (command), Scheduled tasks (scheduled_task), Outgoing requests (outgoing_request) |
| Name pattern | Optional; which routes/jobs/queries it applies to |
| Metric | p95 or max |
| Threshold | Milliseconds (1 – 86 400 000) |
| Window | Minutes (1–1440) |
| Minimum count | Ignore windows with fewer events |
At most 25 distinct names may breach one threshold per evaluation.
Heartbeats
Section titled “Heartbeats”Every scheduled job with Heartbeat on — including the Laravel scheduler — reports each run. Falak knows each job’s schedule, so a run that does not arrive within the grace period (120 s by default, FALAK_INSIGHTS_HEARTBEAT_GRACE, adjustable per monitor 0–86400 s) is missed: it opens a heartbeat issue and fires insights.heartbeat_missed (critical).
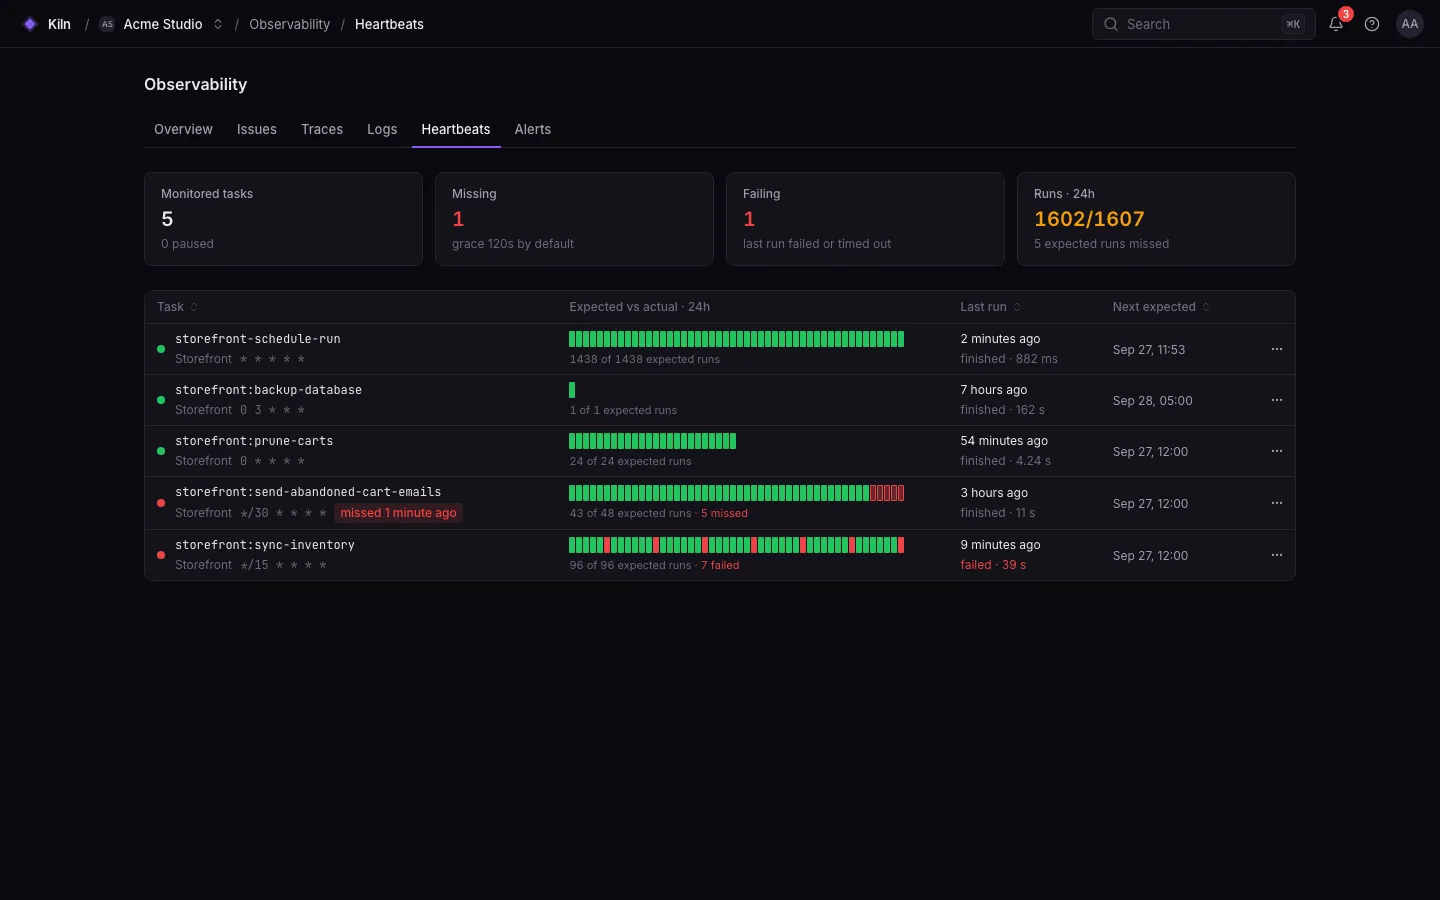
Monitors are created automatically when schedules are applied, so a job that never runs is detected too. Removed jobs stop being expected.
Alerts from Insights
Section titled “Alerts from Insights”| Alert type | Severity |
|---|---|
insights.issue_opened |
warning |
insights.issue_regressed |
warning |
insights.issue_resolved |
info |
insights.threshold_breached |
warning |
insights.heartbeat_missed |
critical |
Route them in Alerts.
Retention
Section titled “Retention”Occurrences, per-minute aggregates and heartbeat runs are kept for 30 days (FALAK_INSIGHTS_RETENTION_DAYS). Issues and their counters are kept.